Docker 中无法使用 JDK jmap之 Can't attach to the process: ptrace(PTRACE_ATTACH问题
问题描述
一个老服务最近出现OOM问题了(日志中发现的),但是由于启动参数没有添加 -XX:+HeapDumpOnOutOfMemoryError无法获取dump文件,这时想着使用jmap获取dump文件,结果执行jmap报如下错:
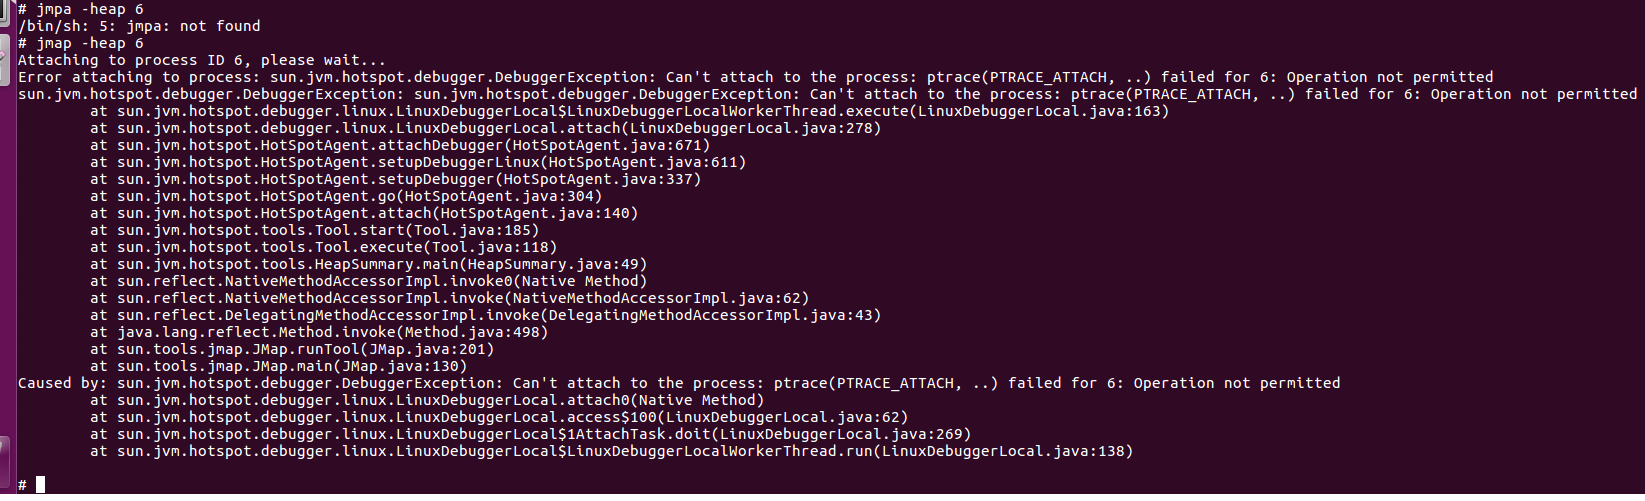
# jmap -heap 6Attaching to process ID 6, please wait...Error attaching to process: sun.jvm.hotspot.debugger.DebuggerException: Can't attach to the process: ptrace(PTRACE_ATTACH, ..) failed for 6: Operation not permitted sun.jvm.hotspot.debugger.DebuggerException: sun.jvm.hotspot.debugger.DebuggerException: Can't attach to the process: ptrace(PTRACE_ATTACH, ..) failed for 6: Operation not permittedat sun.jvm.hotspot.debugger.linux.LinuxDebuggerLocal$LinuxDebuggerLocalWorkerThread.execute(LinuxDebuggerLocal.java:163)at sun.jvm.hotspot.debugger.linux.LinuxDebuggerLocal.attach(LinuxDebuggerLocal.java:278)at sun.jvm.hotspot.HotSpotAgent.attachDebugger(HotSpotAgent.java:671)at sun.jvm.hotspot.HotSpotAgent.setupDebuggerLinux(HotSpotAgent.java:611)at sun.jvm.hotspot.HotSpotAgent.setupDebugger(HotSpotAgent.java:337)at sun.jvm.hotspot.HotSpotAgent.go(HotSpotAgent.java:304)at sun.jvm.hotspot.HotSpotAgent.attach(HotSpotAgent.java:140)at sun.jvm.hotspot.tools.Tool.start(Tool.java:185)at sun.jvm.hotspot.tools.Tool.execute(Tool.java:118)at sun.jvm.hotspot.tools.HeapSummary.main(HeapSummary.java:49)at sun.reflect.NativeMethodAccessorImpl.invoke0(Native Method)at sun.reflect.NativeMethodAccessorImpl.invoke(NativeMethodAccessorImpl.java:62)at sun.reflect.DelegatingMethodAccessorImpl.invoke(DelegatingMethodAccessorImpl.java:43)at java.lang.reflect.Method.invoke(Method.java:498)at sun.tools.jmap.JMap.runTool(JMap.java:201)at sun.tools.jmap.JMap.main(JMap.java:130)Caused by: sun.jvm.hotspot.debugger.DebuggerException: Can't attach to the process: ptrace(PTRACE_ATTACH, ..) failed for 6: Operation not permittedat sun.jvm.hotspot.debugger.linux.LinuxDebuggerLocal.attach0(Native Method)at sun.jvm.hotspot.debugger.linux.LinuxDebuggerLocal.access$100(LinuxDebuggerLocal.java:62)at sun.jvm.hotspot.debugger.linux.LinuxDebuggerLocal$1AttachTask.doit(LinuxDebuggerLocal.java:269)at sun.jvm.hotspot.debugger.linux.LinuxDebuggerLocal$LinuxDebuggerLocalWorkerThread.run(LinuxDebuggerLocal.java:138)
问题分析
百度和google之后,我们发现docker的官方文档提到了。
这不是什么 docker 或者jmap的Bug,而是 Docker 自 1.10 版本开始加入的安全特性。 jmap 这类 JDK 工具依赖于 Linux 的 PTRACE_ATTACH,而 Docker 自 1.10 版本开始,默认的 seccomp 配置文件中禁用了 ptrace。
主要提及三种:
1.1 –security-opt seccomp=unconfined
直接关闭 seccomp 配置或者将ptrace添加到允许的名单中。用法:
docker run --security-opt seccomp:unconfined ...
官方文档提到you can pass unconfined to run a container without the default seccomp profile. 连接为https://docs.docker.com/engine/security/seccomp/
1.2 –cap-add=SYS_PTRACE
使用 —cap-add 明确添加指定功能:
docker run --cap-add=SYS_PTRACE ...
官方文档连接https://docs.docker.com/engine/reference/run/
1.3 Docker Compose 的支持
Docker Compose 自 version 1.1.0 (2015-02-25) 起支持 cap_add。官方文档:cap_add, cap_drop。用法:
前面的 docker-compose.yml 改写后文件内容如下(相同内容部分就不重复贴了):
version: '2'services:mysql:...api:...cap_add:- SYS_PTRACE
官方连接在https://docs.docker.com/compose/compose-file/compose-file-v2/\#cap\_add-cap\_drop
最终解决办法
本人最终以类似如下方式启动容器,然后 执行jmap命令
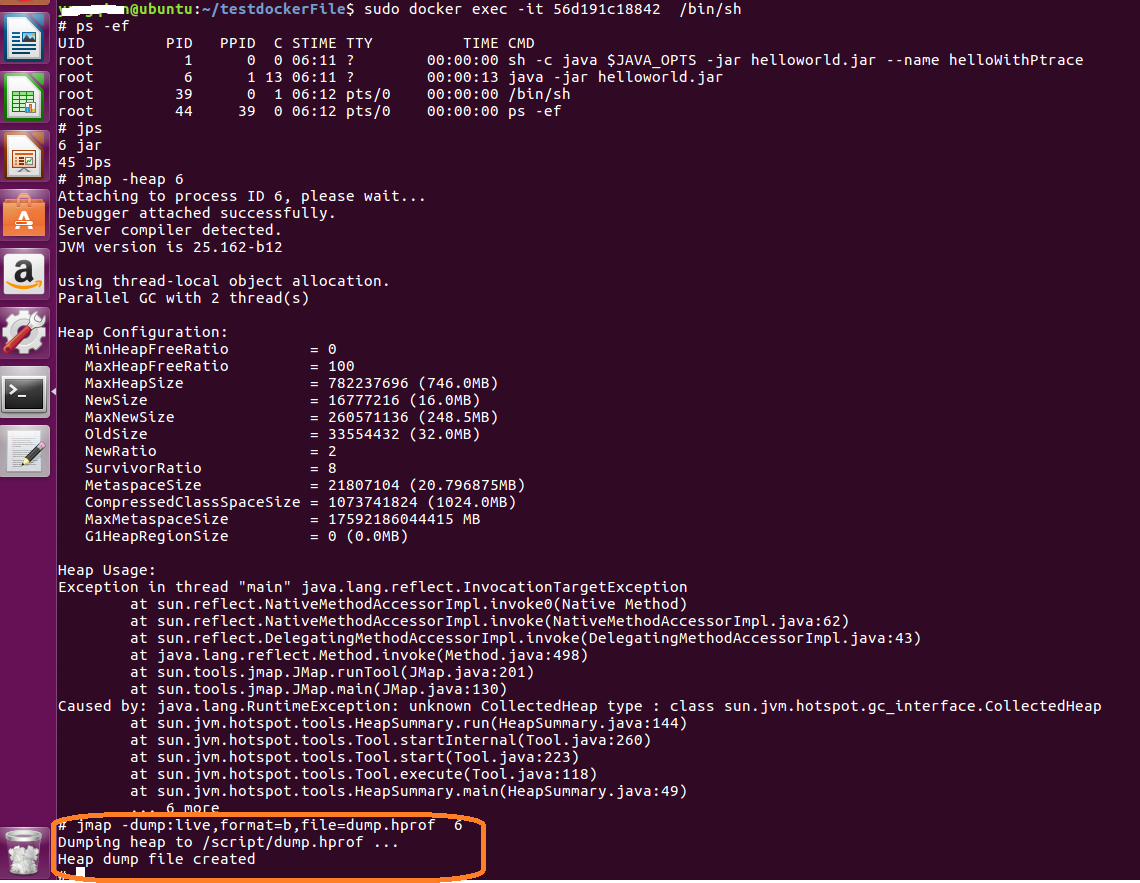
启动容器的命令参数docker run --cap-add=SYS_PTRACE -d -p 8080:8080 hello:v2 --name helloWithPtrace# jmap -heap 6Attaching to process ID 6, please wait...Debugger attached successfully.Server compiler detected.JVM version is 25.162-b12using thread-local object allocation.Parallel GC with 2 thread(s)Heap Configuration:MinHeapFreeRatio = 0MaxHeapFreeRatio = 100MaxHeapSize = 782237696 (746.0MB)NewSize = 16777216 (16.0MB)MaxNewSize = 260571136 (248.5MB)OldSize = 33554432 (32.0MB)NewRatio = 2SurvivorRatio = 8MetaspaceSize = 21807104 (20.796875MB)CompressedClassSpaceSize = 1073741824 (1024.0MB)MaxMetaspaceSize = 17592186044415 MBG1HeapRegionSize = 0 (0.0MB)Heap Usage:Exception in thread "main" java.lang.reflect.InvocationTargetExceptionat sun.reflect.NativeMethodAccessorImpl.invoke0(Native Method)at sun.reflect.NativeMethodAccessorImpl.invoke(NativeMethodAccessorImpl.java:62)at sun.reflect.DelegatingMethodAccessorImpl.invoke(DelegatingMethodAccessorImpl.java:43)at java.lang.reflect.Method.invoke(Method.java:498)at sun.tools.jmap.JMap.runTool(JMap.java:201)at sun.tools.jmap.JMap.main(JMap.java:130)Caused by: java.lang.RuntimeException: unknown CollectedHeap type : class sun.jvm.hotspot.gc_interface.CollectedHeapat sun.jvm.hotspot.tools.HeapSummary.run(HeapSummary.java:144)at sun.jvm.hotspot.tools.Tool.startInternal(Tool.java:260)at sun.jvm.hotspot.tools.Tool.start(Tool.java:223)at sun.jvm.hotspot.tools.Tool.execute(Tool.java:118)at sun.jvm.hotspot.tools.HeapSummary.main(HeapSummary.java:49)... 6 more#


.项目访问路径去掉项目名之tomcat配置")


还没有评论,来说两句吧...