HTML Canvas 学习笔记
Reference
- Link 1
- Link 2
Description
The HTML5
However, the
The getContext() method returns an object that provides methods and properties for drawing on the canvas.
This reference will cover the properties and methods of the getContext(“2d”) object, which can be used to draw text, lines, boxes, circles, and more - on the canvas.
Browser Support
Internet Explorer 9, Firefox, Opera, Chrome, and Safari support
Note: Internet Explorer 8 and earlier versions, do not support the
Colors, Styles, and Shadows
| Property | Description |
|---|---|
| fillStyle | Sets or returns the color, gradient, or pattern used to fill the drawing |
| strokeStyle | Sets or returns the color, gradient, or pattern used for strokes |
| shadowColor | Sets or returns the color to use for shadows |
| shadowBlur | Sets or returns the blur level for shadows |
| shadowOffsetX | Sets or returns the horizontal distance of the shadow from the shape |
| shadowOffsetY | Sets or returns the vertical distance of the shadow from the shape |
| Method | Description |
|---|---|
| createLinearGradient() | Creates a linear gradient (to use on canvas content) |
| createPattern() | Repeats a specified element in the specified direction |
| createRadialGradient() | Creates a radial/circular gradient (to use on canvas content) |
| addColorStop() | Specifies the colors and stop positions in a gradient object |
Property
fillStyle
Sets or returns the color, gradient, or pattern used to fill the drawing
gradient
英 [ˈɡreɪdiənt] 美 [ˈɡreɪdiənt]
n. (尤指公路或铁路的)坡度,斜率,倾斜度; (温度、压力等的)变化率,梯度变化曲线
Definition and Usage
The fillStyle property sets or returns the color, gradient, or pattern used to fill the drawing.
| Default value: | #000000 |
| JavaScript syntax: | context.fillStyle=color|gradient|pattern; |
Property Values
| Value | Description |
|---|---|
| color | A CSS color value that indicates the fill color of the drawing. Default value is #000000 |
| gradient | A gradient object (linear or radial) used to fill the drawing |
| pattern | A pattern object to use to fill the drawing |
Example
1 Define a red fill-color for the rectangle
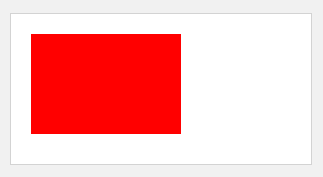
var c=document.getElementById("myCanvas");var ctx=c.getContext("2d");ctx.fillStyle="#FF0000";ctx.fillRect(20,20,150,100);
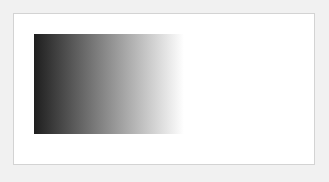
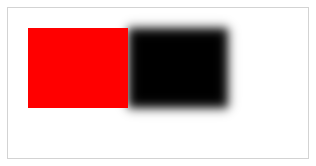
2 Define a gradient (top to bottom) as the fill style for the rectangle

var c=document.getElementById("myCanvas");var ctx=c.getContext("2d");var my_gradient=ctx.createLinearGradient(0,0,0,170);my_gradient.addColorStop(0,"black");my_gradient.addColorStop(1,"white");ctx.fillStyle=my_gradient;ctx.fillRect(20,20,150,100);
3 Define a gradient (left to right) as the fill style for the rectangle
var c=document.getElementById("myCanvas");var ctx=c.getContext("2d");var my_gradient=ctx.createLinearGradient(0,0,170,0);my_gradient.addColorStop(0,"black");my_gradient.addColorStop(1,"white");ctx.fillStyle=my_gradient;ctx.fillRect(20,20,150,100);
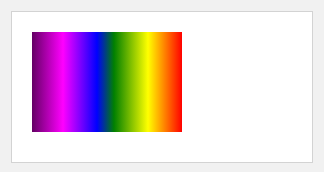
4 Define a gradient that goes from black, to red, to white, as the fill style for the rectangle
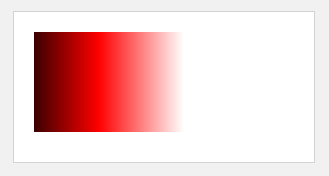
var c=document.getElementById("myCanvas");var ctx=c.getContext("2d");var my_gradient=ctx.createLinearGradient(0,0,170,0);my_gradient.addColorStop(0,"black");my_gradient.addColorStop(0.5,"red");my_gradient.addColorStop(1,"white");ctx.fillStyle=my_gradient;ctx.fillRect(20,20,150,100);
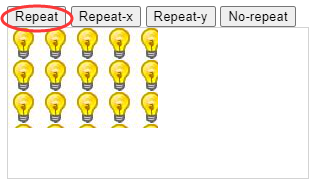
5 Use an image to fill the drawing
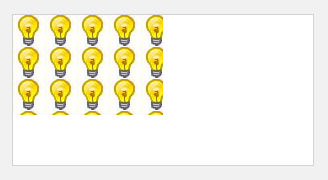
var c=document.getElementById("myCanvas");var ctx=c.getContext("2d");var img=document.getElementById("lamp");var pat=ctx.createPattern(img,"repeat");ctx.rect(0,0,150,100);ctx.fillStyle=pat;ctx.fill();
strokeStyle
Sets or returns the color, gradient, or pattern used for strokes
stroke
英 [strəʊk] 美 [stroʊk]
n. (打、击等的)一下;击球(动作);一击;划水动作;划桨动作
vt. 轻抚(动物的毛皮);抚摩(物体表面或头发等);轻挪;轻触;轻拭
Definition and Usage
The strokeStyle property sets or returns the color, gradient, or pattern used for strokes.
| Default value: | #000000 |
| JavaScript syntax: | context.strokeStyle=color|gradient|pattern; |
Property Values
| Value | Description |
|---|---|
| color | A CSS color value that indicates the stroke color of the drawing. Default value is #000000 |
| gradient | A gradient object (linear or radial) used to create a gradient stroke |
| pattern | A pattern object used to create a pattern stroke |
Example
1 Use a stroke color of red to draw a rectangle.
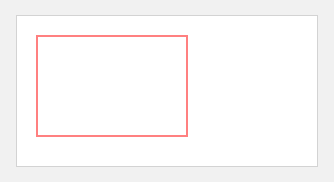
var c=document.getElementById("myCanvas");var ctx=c.getContext("2d");ctx.strokeStyle="#FF0000";ctx.strokeRect(20,20,150,100);
2 Use a gradient stroke to draw a rectangle.
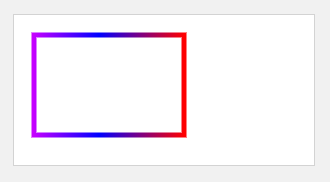
var c=document.getElementById("myCanvas");var ctx=c.getContext("2d");var gradient=ctx.createLinearGradient(0,0,170,0);gradient.addColorStop("0","magenta");gradient.addColorStop("0.5","blue");gradient.addColorStop("1.0","red");// Fill with gradientctx.strokeStyle=gradient;ctx.lineWidth=5;ctx.strokeRect(20,20,150,100);
3 Write the text “Big smile!” with a gradient stroke
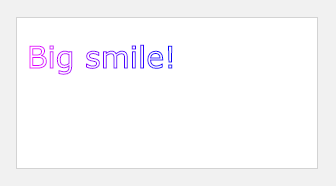
var c=document.getElementById("myCanvas");var ctx=c.getContext("2d");ctx.font="30px Verdana";// Create gradientvar gradient=ctx.createLinearGradient(0,0,c.width,0);gradient.addColorStop("0","magenta");gradient.addColorStop("0.5","blue");gradient.addColorStop("1.0","red");// Fill with gradientctx.strokeStyle=gradient;ctx.strokeText("Big smile!",10,50);
shadowColor
Sets or returns the color to use for shadows
Definition and Usage
The shadowColor property sets or returns the color to use for shadows.
Note: Use the shadowColor property together with the shadowBlur property to create a shadow.
Tip: Adjust the shadow by using the shadowOffsetX and shadowOffsetY properties.
| Default value: | #000000 |
| JavaScript syntax: | context.shadowColor=color; |
Property Values
| Value | Description |
|---|---|
| color | The CSS color value to use for shadows. Default value is #000000 |
Example
1 Draw a red rectangle with a black shadow
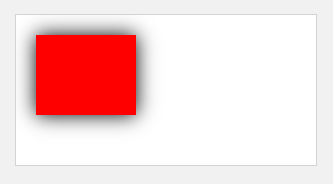
var c=document.getElementById("myCanvas");var ctx=c.getContext("2d");ctx.shadowBlur=20;ctx.shadowColor="black";ctx.fillStyle="red";ctx.fillRect(20,20,100,80);
shadowBlur
Sets or returns the blur level for shadows
Definition and Usage
The shadowBlur property sets or returns the blur level for shadows.
| Default value: | 0 |
| JavaScript syntax: | context.shadowBlur=number; |
Property Values
| Value | Description |
|---|---|
| number | The blur level for the shadow |
Example
1 Draw a red rectangle with a black shadow, with blur level of 20
var c=document.getElementById("myCanvas");var ctx=c.getContext("2d");ctx.shadowBlur=20;ctx.shadowColor="black";ctx.fillStyle="red";ctx.fillRect(20,20,100,80);
shadowOffsetX
Sets or returns the horizontal distance of the shadow from the shape
Definition and Usage
The shadowOffsetX property sets or returns the horizontal distance of the shadow from the shape.
- shadowOffsetX=0 indicates that the shadow is right behind the shape.
- shadowOffsetX=20 indicates that the shadow starts 20 pixels to the right (from the shape’s left position).
- shadowOffsetX=-20 indicates that the shadow starts 20 pixels to the left (from the shape’s left position).
Tip: To adjust the vertical distance of the shadow from the shape, use the shadowOffsetY property.
| Default value: | 0 |
| JavaScript syntax: | context.shadowOffsetX=number; |
Property Values
| Value | Description |
|---|---|
| number | A positive or negative number that defines the horizontal distance of the shadow from the shape |
Example
1 Draw a rectangle with a shadow placed 20/100 pixels to the right (from the rectangle’s left position)
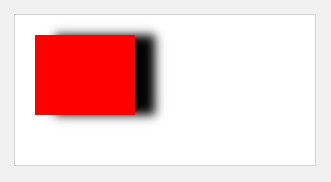
var c=document.getElementById("myCanvas");var ctx=c.getContext("2d");ctx.shadowBlur=10;ctx.shadowOffsetX=20;ctx.shadowColor="black";ctx.fillStyle="red";ctx.fillRect(20,20,100,80);
var c = document.getElementById("myCanvas");var ctx = c.getContext("2d");ctx.shadowBlur = 10;ctx.shadowOffsetX = 100;ctx.shadowColor = "black";ctx.fillStyle= "red";ctx.fillRect(20, 20, 100, 80);
shadowOffsetY
Sets or returns the vertical distance of the shadow from the shape
Definition and Usage
The shadowOffsetY property sets or returns the vertical distance of the shadow from the shape.
- shadowOffsety=0 indicates that the shadow is right behind the shape.
- shadowOffsetY=20 indicates that the shadow starts 20 pixels below the shape’s top position.
- shadowOffsetY=-20 indicates that the shadow starts 20 pixels above the shape’s top position.
Tip: To adjust the horizontal distance of the shadow from the shape, use the shadowOffsetX property.
| Default value: | 0 |
| JavaScript syntax: | context.shadowOffsetY=number; |
Property Values
| Value | Description |
|---|---|
| number | A positive or negative number that defines the vertical distance of the shadow from the shape |
Example
1 Draw a rectangle with a shadow placed 20 pixels below the rectangle’s top position
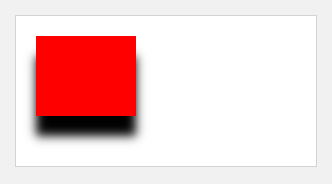
var c=document.getElementById("myCanvas");var ctx=c.getContext("2d");ctx.shadowBlur=10;ctx.shadowOffsetY=20;ctx.shadowColor="black";ctx.fillStyle="red";ctx.fillRect(20,20,100,80);
Method
createLinearGradient()
Definition and Usage
The createLinearGradient() method creates a linear gradient object.
The gradient can be used to fill rectangles, circles, lines, text, etc.
Tip: Use this object as the value to the strokeStyle or fillStyle properties.
Tip: Use the addColorStop() method to specify different colors, and where to position the colors in the gradient object.
| JavaScript syntax: | context.createLinearGradient(x0,y0,x1,y1); |
Parameter Values
| Parameter | Description |
|---|---|
| x0 | The x-coordinate of the start point of the gradient |
| y0 | The y-coordinate of the start point of the gradient |
| x1 | The x-coordinate of the end point of the gradient |
| y1 | The y-coordinate of the end point of the gradient |
Example
查阅前文的fillStyle的Example 2、3、4,strokeStyle的Example 2。
createPattern()
Definition and Usage
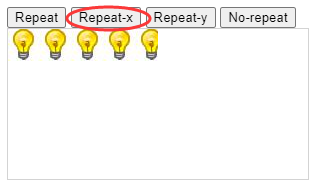
The createPattern() method repeats the specified element in the specified direction.
The element can be an image, video, or another
The repeated element can be used to draw/fill rectangles, circles, lines etc.
| JavaScript syntax: | context.createPattern(image,“repeat|repeat-x|repeat-y|no-repeat”); |
Parameter Values
| Parameter | Description |
|---|---|
| image | Specifies the image, canvas, or video element of the pattern to use |
| repeat | Default. The pattern repeats both horizontally and vertically |
| repeat-x | The pattern repeats only horizontally |
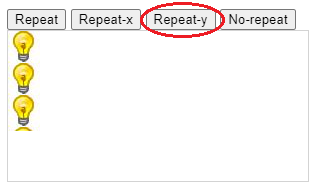
| repeat-y | The pattern repeats only vertically |
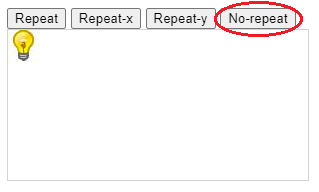
| no-repeat | The pattern will be displayed only once (no repeat) |
Example
查阅前文的fillStyle的Example 5
当参数为repeat:
当参数为repeat-x:
当参数为repeat-y:
当参数为no-repeat:
createRadialGradient()
Definition and Usage
The createRadialGradient() method creates a radial/circular gradient object.
The gradient can be used to fill rectangles, circles, lines, text, etc.
Tip: Use this object as the value to the strokeStyle or fillStyle properties.
Tip: Use the addColorStop() method to specify different colors, and where to position the colors in the gradient object.
| JavaScript syntax: | context.createRadialGradient(x0,y0,r0,x1,y1,r1); |
Parameter Values
| Parameter | Description |
|---|---|
| x0 | The x-coordinate of the starting circle of the gradient |
| y0 | The y-coordinate of the starting circle of the gradient |
| r0 | The radius of the starting circle |
| x1 | The x-coordinate of the ending circle of the gradient |
| y1 | The y-coordinate of the ending circle of the gradient |
| r1 | The radius of the ending circle |
Example
1 Draw a rectangle and fill with a radial/circular gradient:
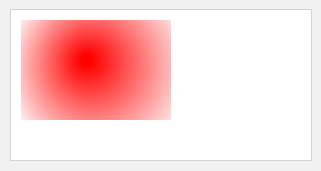
var c=document.getElementById("myCanvas");var ctx=c.getContext("2d");var grd=ctx.createRadialGradient(75,50,5,90,60,100);grd.addColorStop(0,"red");grd.addColorStop(1,"white");// Fill with gradientctx.fillStyle=grd;ctx.fillRect(10,10,150,100);
addColorStop()
Definition and Usage
The addColorStop() method specifies the colors and position in a gradient object.
The addColorStop() method is used together with createLinearGradient() or createRadialGradient().
Note: You can call the addColorStop() method multiple times to change a gradient. If you omit this method for gradient objects, the gradient will not be visible. You need to create at least one color stop to have a visible gradient.
| JavaScript syntax: | gradient.addColorStop(stop,color); |
Parameter Values
| Parameter | Description |
|---|---|
| stop | A value between 0.0 and 1.0 that represents the position between start and end in a gradient |
| color | A CSS color value to display at the stop position |
Example
1 Define a gradient with multiple addColorStop() methods
var c=document.getElementById("myCanvas");var ctx=c.getContext("2d");var grd=ctx.createLinearGradient(0,0,170,0);grd.addColorStop(0,"black");grd.addColorStop(0.3,"magenta");grd.addColorStop(0.5,"blue");grd.addColorStop(0.6,"green");grd.addColorStop(0.8,"yellow");grd.addColorStop(1,"red");ctx.fillStyle=grd;ctx.fillRect(20,20,150,100);
Line Styles
| Property | Description |
|---|---|
| lineCap | Sets or returns the style of the end caps for a line |
| lineJoin | Sets or returns the type of corner created, when two lines meet |
| lineWidth | Sets or returns the current line width |
| miterLimit | Sets or returns the maximum miter length |
Property
lineCap
Sets or returns the style of the end caps for a line
Definition and Usage
The lineCap property sets or returns the style of the end caps for a line.
Note: The value “round” and “square” make the lines slightly longer.
| Default value: | butt |
| JavaScript syntax: | context.lineCap=“butt|round|square”; |
Property Values
| Value | Description |
|---|---|
| butt | Default. A flat edge is added to each end of the line |
| round | A rounded end cap is added to each end of the line |
| square | A square end cap is added to each end of the line |
Example
1 Draw a line with end caps
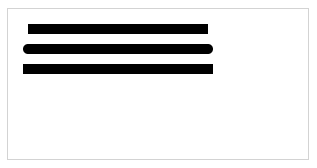
var c = document.getElementById("myCanvas");var ctx = c.getContext("2d");ctx.beginPath();ctx.lineWidth = 10;ctx.lineCap = "butt";ctx.moveTo(20, 20);ctx.lineTo(200, 20);ctx.stroke();ctx.beginPath();ctx.lineCap = "round";ctx.moveTo(20, 40);ctx.lineTo(200, 40);ctx.stroke();ctx.beginPath();ctx.lineCap = "square";ctx.moveTo(20, 60);ctx.lineTo(200, 60);ctx.stroke();
lineJoin
Sets or returns the type of corner created, when two lines meet
Definition and Usage
The lineJoin property sets or returns the type of corner created, when two lines meet.
Note: The “miter” value is affected by the miterLimit property.
| Default value: | miter |
| JavaScript syntax: | context.lineJoin=“bevel|round|miter”; |
Property Values
| Value | Description |
|---|---|
| bevel | Creates a beveled corner |
| round | Creates a rounded corner |
| miter | Default. Creates a sharp corner |
bevel
英 [ˈbevl] 美 [ˈbevl]
n. 斜边;斜面;斜角规
v. 把(物体的方形边)改成斜面边miter
英 [ˈmaɪtə®] 美 [ˈmaɪtər]
n. 主教法冠;斜接
v. 给主教等加冠;使斜接
Example
1 Create a different corner when the two lines meet
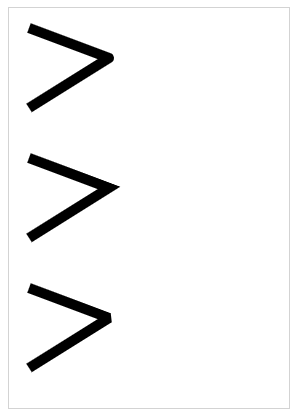
var c = document.getElementById("myCanvas");var ctx = c.getContext("2d");ctx.beginPath();ctx.lineWidth = 10;ctx.lineJoin = "round";//<---------------ctx.moveTo(20, 20);ctx.lineTo(100, 50);ctx.lineTo(20, 100);ctx.stroke();ctx = c.getContext("2d");ctx.beginPath();ctx.lineWidth = 10;ctx.lineJoin = "miter";//<--------------- Default. Creates a sharp cornerctx.moveTo(20, 150);ctx.lineTo(100, 180);ctx.lineTo(20, 230);ctx.stroke();ctx = c.getContext("2d");ctx.beginPath();ctx.lineWidth = 10;ctx.lineJoin = "bevel";//<--------------- 类似条形纸条斜折效果ctx.moveTo(20, 280);ctx.lineTo(100, 310);ctx.lineTo(20, 360);ctx.stroke();
lineWidth
Sets or returns the current line width
Definition and Usage
The lineWidth property sets or returns the current line width, in pixels.
| Default value: | 1 |
| JavaScript syntax: | context.lineWidth=number; |
Property Values
| Value | Description |
|---|---|
| number | The current line width, in pixels |
Example
参考上文lineJoin的例子
miterLimit
Sets or returns the maximum miter length
Definition and Usage
The miterLimit property sets or returns the maximum miter length.
The miter length is the distance between the inner corner and the outer corner where two lines meet.
Tip: The miterLimit property works only if the lineJoin attribute is “miter”.
The miter length grows bigger as the angle of the corner gets smaller.
To prevent the miter length from being too long, we can use the miterLimit property.
If the miter length exceeds the miterLimit value, the corner will be displayed as lineJoin type “bevel” (类似条形纸条斜折效果)(Fig 3):
| Default value: | 10 |
| JavaScript syntax: | context.miterLimit=number; |
Property Values
| Value | Description |
|---|---|
| number | A positive number that specifies the maximum miter length. If the current miter length exceeds the miterLimit, the corner will display as lineJoin “bevel” |
Example
1 Draw lines with the maximum miter length of 5
var c = document.getElementById("myCanvas");var ctx = c.getContext("2d");ctx.lineWidth = 10;ctx.lineJoin = "miter";ctx.miterLimit = 5;ctx.moveTo(20, 20);ctx.lineTo(50, 27);ctx.lineTo(20, 34);ctx.stroke();/* set the miterLimit to 4 (then, the miter length will exceed the miter limit), and when the lines meet it will be displayed as lineJoin="bevel". */ctx = c.getContext("2d");ctx.lineWidth = 10;ctx.lineJoin = "miter";ctx.miterLimit = 4;ctx.moveTo(20, 50);ctx.lineTo(50, 57);ctx.lineTo(20, 64);ctx.stroke();
Rectangles
Method
| Method | Description |
|---|---|
| rect() | Creates a rectangle |
| fillRect() | Draws a “filled” rectangle |
| strokeRect() | Draws a rectangle (no fill) |
| clearRect() | Clears the specified pixels within a given rectangle |
rect()
Creates a rectangle
Definition and Usage
The rect() method creates a rectangle.
Tip: Use the stroke()or the fill() method to actually draw the rectangle on the canvas.
| JavaScript syntax: | context.rect(x,y,width,height); |
Parameter Values
| Parameter | Description |
|---|---|
| x | The x-coordinate of the upper-left corner of the rectangle |
| y | The y-coordinate of the upper-left corner of the rectangle |
| width | The width of the rectangle, in pixels |
| height | The height of the rectangle, in pixels |
Example
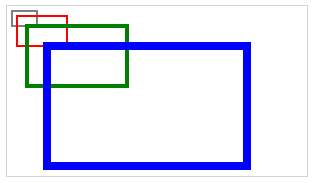
1 Create three rectangles with the rect() method
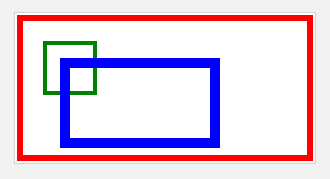
var c=document.getElementById("myCanvas");var ctx=c.getContext("2d");// Red rectanglectx.beginPath();ctx.lineWidth="6";ctx.strokeStyle="red";ctx.rect(5,5,290,140);ctx.stroke();// Green rectanglectx.beginPath();ctx.lineWidth="4";ctx.strokeStyle="green";ctx.rect(30,30,50,50);ctx.stroke();// Blue rectanglectx.beginPath();ctx.lineWidth="10";ctx.strokeStyle="blue";ctx.rect(50,50,150,80);ctx.stroke();
fillRect()
Draws a “filled” rectangle
Definition and Usage
The fillRect() method draws a “filled” rectangle. The default color of the fill is black.
Tip: Use the fillStyle property to set a color, gradient, or pattern used to fill the drawing.
| JavaScript syntax: | context.fillRect(x,y,width,height); |
Parameter Values
| Parameter | Description |
|---|---|
| x | The x-coordinate of the upper-left corner of the rectangle |
| y | The y-coordinate of the upper-left corner of the rectangle |
| width | The width of the rectangle, in pixels |
| height | The height of the rectangle, in pixels |
Example
1 Draw a filled 150*100 pixels rectangle
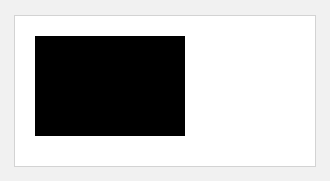
var c=document.getElementById("myCanvas");var ctx=c.getContext("2d");ctx.fillRect(20,20,150,100);
strokeRect()
Draws a rectangle (no fill)
Definition and Usage
The strokeRect() method draws a rectangle (no fill). The default color of the stroke is black.
Tip: Use the strokeStyle property to set a color, gradient, or pattern to style the stroke.
| JavaScript syntax: | context.streRect(x,y,width,height); |
Parameter Values
| Parameter | Description |
|---|---|
| x | The x-coordinate of the upper-left corner of the rectangle |
| y | The y-coordinate of the upper-left corner of the rectangle |
| width | The width of the rectangle, in pixels |
| height | The height of the rectangle, in pixels |
Example
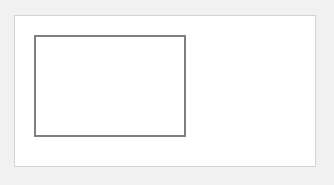
1 Draw a 150*100 pixels rectangle
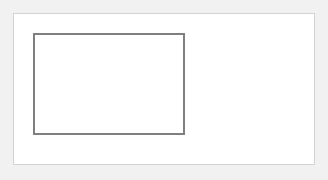
var c=document.getElementById("myCanvas");var ctx=c.getContext("2d");ctx.strokeRect(20,20,150,100);
clearRect()
Clears the specified pixels within a given rectangle
Definition and Usage
The clearRect() method clears the specified pixels within a given rectangle.
| JavaScript syntax: | context.clearRect(x,y,width,height); |
Parameter Values
| Parameter | Description |
|---|---|
| x | The x-coordinate of the upper-left corner of the rectangle to clear |
| y | The y-coordinate of the upper-left corner of the rectangle to clear |
| width | The width of the rectangle to clear, in pixels |
| height | The height of the rectangle to clear, in pixels |
Example
1 Clear a rectangle within a given rectangle
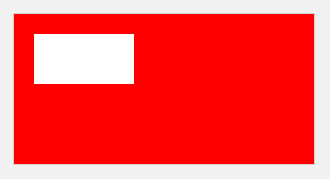
var c=document.getElementById("myCanvas");var ctx=c.getContext("2d");ctx.fillStyle="red";ctx.fillRect(0,0,300,150);ctx.clearRect(20,20,100,50);
Paths
| Method | Description |
|---|---|
| fill() | Fills the current drawing (path) |
| stroke() | Actually draws the path you have defined |
| beginPath() | Begins a path, or resets the current path |
| moveTo() | Moves the path to the specified point in the canvas, without creating a line |
| closePath() | Creates a path from the current point back to the starting point |
| lineTo() | Adds a new point and creates a line to that point from the last specified point in the canvas |
| clip() | Clips a region of any shape and size from the original canvas |
| quadraticCurveTo() | Creates a quadratic Bézier curve |
| bezierCurveTo() | Creates a cubic Bézier curve |
| arc() | Creates an arc/curve (used to create circles, or parts of circles) |
| arcTo() | Creates an arc/curve between two tangents |
| isPointInPath() | Returns true if the specified point is in the current path, otherwise false |
Method
fill()
Fills the current drawing (path)
Definition and Usage
The fill() method fills the current drawing (path). The default color is black.
Tip: Use the fillStyle property to fill with another color/gradient.
Note: If the path is not closed, the fill() method will add a line from the last point to the startpoint of the path to close the path (like closePath()), and then fill the path.
| JavaScript syntax: | context.fill(); |
Example
1 Draw two 150*100 pixels rectangles. Fill one with a red color and the other with a blue color
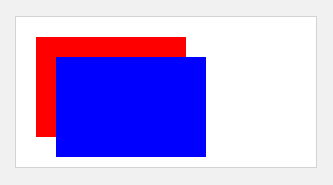
var c = document.getElementById("myCanvas");var ctx = c.getContext("2d");ctx.beginPath();ctx.rect(20, 20, 150, 100);ctx.fillStyle = "red";ctx.fill();ctx.beginPath();ctx.rect(40, 40, 150, 100);ctx.fillStyle = "blue";ctx.fill();
stroke()
Actually draws the path you have defined
stroke
英 [strəʊk] 美 [stroʊk]
n. (打、击等的)一下;击球(动作);一击;划水动作;划桨动作;中风
vt. 轻抚(动物的毛皮);抚摩(物体表面或头发等);轻挪;轻触;轻拭
Definition and Usage
The stroke() method actually draws the path you have defined with all those moveTo() and lineTo() methods. The default color is black.
Tip: Use the strokeStyle property to draw with another color/gradient.
| JavaScript syntax: | context.stroke(); |
Example
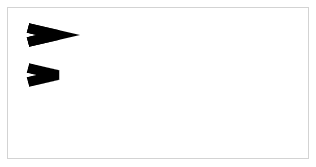
1 Draw a path, shaped as the letter L - in a red color
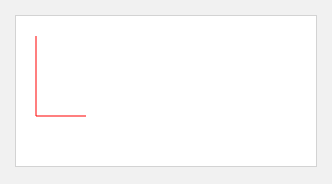
var c=document.getElementById("myCanvas");var ctx=c.getContext("2d");ctx.beginPath();ctx.moveTo(20,20);ctx.lineTo(20,100);ctx.lineTo(70,100);ctx.strokeStyle="red";ctx.stroke();
beginPath()
Begins a path, or resets the current path
Definition and Usage
The beginPath() method begins a path, or resets the current path.
Tip: Use moveTo(), lineTo(), quadricCurveTo(), bezierCurveTo(), arcTo(), and arc(), to create paths.
Tip: Use the stroke() method to actually draw the path on the canvas.
| JavaScript syntax: | context.beginPath(); |
Example
1 Draw two paths on the canvas; one green and one purple
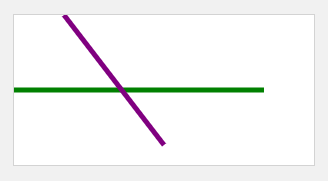
var c=document.getElementById("myCanvas");var ctx=c.getContext("2d");ctx.beginPath();ctx.lineWidth="5";ctx.strokeStyle="green"; // Green pathctx.moveTo(0,75);ctx.lineTo(250,75);ctx.stroke(); // Draw itctx.beginPath();ctx.strokeStyle="purple"; // Purple pathctx.moveTo(50,0);ctx.lineTo(150,130);ctx.stroke(); // Draw it
moveTo()
Moves the path to the specified point in the canvas, without creating a line
Definition and Usage
The moveTo() method moves the path to the specified point in the canvas, without creating a line.
Tip: Use the stroke() method to actually draw the path on the canvas.
| JavaScript syntax: | context.moveTo(x,y); |
Parameter Values
| Parameter | Description |
|---|---|
| x | The x-coordinate of where to move the path to |
| y | The y-coordinate of where to move the path to |
Example
1 Begin a path, move to position 0,0. Create a line to position 300,150
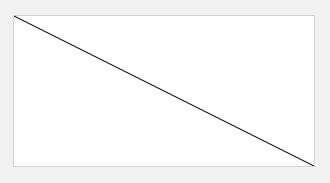
var c=document.getElementById("myCanvas");var ctx=c.getContext("2d");ctx.beginPath();ctx.moveTo(0,0);ctx.lineTo(300,150);ctx.stroke();
closePath()
Creates a path from the current point back to the starting point
Definition and Usage
The closePath() method creates a path from the current point back to the starting point.
Tip: Use the stroke() method to actually draw the path on the canvas.
Tip: Use the fill() method to fill the drawing (black is default). Use the fillStyle property to fill with another color/gradient.
| JavaScript syntax: | context.closePath(); |
Example
1 Draw a path, shaped as the letter L, and then draw a line back to the starting point
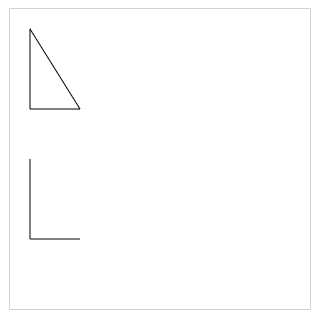
var c = document.getElementById("myCanvas");var ctx = c.getContext("2d");ctx.beginPath();ctx.moveTo(20, 20);ctx.lineTo(20, 100);ctx.lineTo(70, 100);ctx.closePath();ctx.stroke();ctx.beginPath();ctx.moveTo(20, 150);ctx.lineTo(20, 230);ctx.lineTo(70, 230);//ctx.closePath();//<----------注释掉ctx.closePath()ctx.stroke();
lineTo()
Adds a new point and creates a line to that point from the last specified point in the canvas
Definition and Usage
The lineTo() method adds a new point and creates a line TO that point FROM the last specified point in the canvas (this method does not draw the line).
Tip: Use the stroke() method to actually draw the path on the canvas.
| JavaScript syntax: | context.lineTo(x,y); |
Parameter Values
| Parameter | Description |
|---|---|
| x | The x-coordinate of where to create the line to |
| y | The y-coordinate of where to create the line to |
Example
参考上文closePath()的Example。
clip()
Clips剪出 a region of any shape and size from the original canvas
clip
英 [klɪp] 美 [klɪp]
n. 夹子;修剪;(金属或塑料的)回形针;首饰别针;剪短
v. 夹住;别住;被夹住;剪(掉);修剪;碰撞(某物的边缘或侧面)
Definition and Usage
The clip() method clips a region of any shape and size from the original canvas.
Tip: Once a region is clipped, all future drawing will be limited to the clipped region (no access to other regions on the canvas). You can however save the current canvas region using the save() method before using the clip() method, and restore it (with the restore() method) any time in the future.
| JavaScript syntax: | context.clip(); |
Example
1 Clip of a rectangular region of 200*120 pixels from the canvas. Then, draw a red rectangle. Only the part of the red rectangle that is inside the clipped area is visible
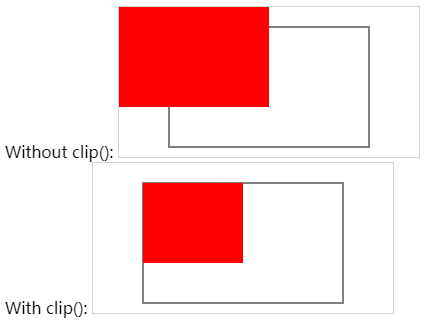
<span>Without clip():</span><canvas id="myCanvas" width="300" height="150" style="border:1px solid #d3d3d3;">Your browser does not support the HTML5 canvas tag.</canvas><script> var c = document.getElementById("myCanvas"); var ctx = c.getContext("2d"); // Draw a rectangle ctx.rect(50, 20, 200, 120); ctx.stroke(); // Draw red rectangle ctx.fillStyle = "red"; ctx.fillRect(0, 0, 150, 100); </script><span>With clip():</span><canvas id="myCanvas2" width="300" height="150" style="border:1px solid #d3d3d3;">Your browser does not support the HTML5 canvas tag.</canvas><script> var c = document.getElementById("myCanvas2"); var ctx = c.getContext("2d"); // Clip a rectangular area ctx.rect(50, 20, 200, 120); ctx.stroke(); ctx.clip(); // Draw red rectangle after clip() ctx.fillStyle = "red"; ctx.fillRect(0, 0, 150, 100); </script>
quadraticCurveTo()
Creates a quadratic Bézier curve
quadratic
英 [kwɒˈdrætɪk] 美 [kwɑːˈdrætɪk]
adj. 平方的;二次方的贝塞尔曲线(Bézier curve),又称贝兹曲线或贝济埃曲线,是应用于二维图形应用程序的数学曲线。一般的矢量图形软件通过它来精确画出曲线,贝兹曲线由线段与节点组成,节点是可拖动的支点,线段像可伸缩的皮筋,我们在绘图工具上看到的钢笔工具就是来做这种矢量曲线的。贝塞尔曲线是计算机图形学中相当重要的参数曲线,在一些比较成熟的位图软件中也有贝塞尔曲线工具,如PhotoShop等。百度百科
Definition and Usage
The quadraticCurveTo() method adds a point to the current path by using the specified control points that represent a quadratic Bézier curve.
A quadratic Bézier curve requires two points. The first point is a control point that is used in the quadratic Bézier calculation and the second point is the ending point for the curve. The starting point for the curve is the last point in the current path. If a path does not exist, use the beginPath() and moveTo() to define a starting point.
Start point:
- moveTo(20,20)
Control point:
- quadraticCurveTo(20,100,200,20)
End point:
- quadraticCurveTo(20,100,200,20)
Tip: Check out the bezierCurveTo() method. It has two control-points instead of one.
| JavaScript syntax: | context.quadraticCurveTo(cpx,cpy,x,y); |
Parameter Values
| Parameter | Description |
|---|---|
| cpx | The x-coordinate of the Bézier control point |
| cpy | The y-coordinate of the Bézier control point |
| x | The x-coordinate of the ending point |
| y | The y-coordinate of the ending point |
Example
1 Draw a quadratic Bézier curve
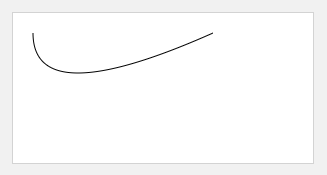
var c=document.getElementById("myCanvas");var ctx=c.getContext("2d");ctx.beginPath();ctx.moveTo(20,20);ctx.quadraticCurveTo(20,100,200,20);ctx.stroke();
bezierCurveTo()
Creates a cubic Bézier curve
cubic
英 [ˈkjuːbɪk] 美 [ˈkjuːbɪk]
adj. 立方体的;立方的;用立方单位度量(或表示)的;立方形的
Definition and Usage
The bezierCurveTo() method adds a point to the current path by using the specified control points that represent a cubic Bézier curve.
A cubic bezier curve requires three points. The first two points are control points that are used in the cubic Bézier calculation and the last point is the ending point for the curve. The starting point for the curve is the last point in the current path. If a path does not exist, use the beginPath() and moveTo() methods to define a starting point.
Start point
- moveTo(20,20)
Control point 1
- bezierCurveTo(20,100,200,100,200,20)
Control point 2
- bezierCurveTo(20,100,200,100,200,20)
End point
- bezierCurveTo(20,100,200,100,200,20)
Tip: Check out the quadraticCurveTo() method. It has one control point instead of two.
| JavaScript syntax: | context.bezierCurveTo(cp1x,cp1y,cp2x,cp2y,x,y); |
Parameter Values
| Parameter | Description |
|---|---|
| cp1x | The x-coordinate of the first Bézier control point |
| cp1y | The y-coordinate of the first Bézier control point |
| cp2x | The x-coordinate of the second Bézier control point |
| cp2y | The y-coordinate of the second Bézier control point |
| x | The x-coordinate of the ending point |
| y | The y-coordinate of the ending point |
Example
1 Draw a cubic Bézier curve
var c=document.getElementById("myCanvas");var ctx=c.getContext("2d");ctx.beginPath();ctx.moveTo(20,20);ctx.bezierCurveTo(20,100,200,100,200,20);ctx.stroke();
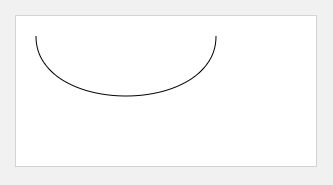
arc()
Creates an arc/curve (used to create circles, or parts of circles)
arc
英 [ɑːk] 美 [ɑːrk]
n. 弧;弧形;电弧
vi. 作弧形运动;形成电弧curve
英 [kɜːv] 美 [kɜːrv]
n. 曲线;弧线;曲面;弯曲;(投向击球员的)曲线球
v. (使)沿曲线运动;呈曲线形
Definition and Usage
The arc() method creates an arc/curve (used to create circles, or parts of circles).
Tip: To create a circle with arc(): Set start angle to 0 and end angle to 2*Math.PI.
Tip: Use the stroke() or the fill() method to actually draw the arc on the canvas.

Center
- arc(100,75,50,0 * Math.PI,1.5 * Math.PI)
Start angle
- arc(100,75,50,**0 * Math.PI ** ,1.5*Math.PI)
End angle
- arc(100,75,50,0 * Math.PI,1.5 * Math.PI)
| JavaScript syntax: | context.arc(x,y,r,sAngle,eAngle,counterclockwise); |
Parameter Values
| Parameter | Description |
|---|---|
| x | The x-coordinate of the center of the circle |
| y | The y-coordinate of the center of the circle |
| r | The radius of the circle |
| sAngle | The starting angle, in radians (0 is at the 3 o’clock position of the arc’s circle) |
| eAngle | The ending angle, in radians |
| counterclockwise | Optional. Specifies whether the drawing should be counterclockwise or clockwise. False is default, and indicates clockwise, while true indicates counter-clockwise. |
clockwise
英 [ˈklɒkwaɪz] 美 [ˈklɑːkwaɪz]
adv./adj.顺时针方向的;顺时针方向(的)counterclockwise
英 [ˌkaʊntəˈklɒkwaɪz] 美 [ˌkaʊntərˈklɑːkwaɪz]
adj. 反时针方向的;逆时针方向的
adv. 逆时针方向地;自右向左地
Example
1 Create a circle
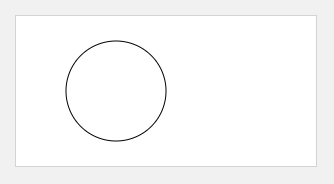
var c=document.getElementById("myCanvas");var ctx=c.getContext("2d");ctx.beginPath();ctx.arc(100,75,50,0,2*Math.PI);ctx.stroke();
arcTo()
Creates an arc/curve between two tangents
tangent
英 [ˈtændʒənt] 美 [ˈtændʒənt]
n. 切线;正切
Definition and Usage
The arcTo() method creates an arc/curve between two tangents on the canvas.
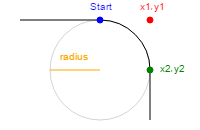
Tip: Use the stroke() method to actually draw the arc on the canvas.
| JavaScript syntax: | context.arcTo(x1,y1,x2,y2,r); |
Parameter Values
| Parameter | Description |
|---|---|
| x1 | The x-coordinate of the first tangent |
| y1 | The y-coordinate of the first tangent |
| x2 | The x-coordinate of the second tangent |
| y2 | The y-coordinate of the second tangent |
| r | The radius of the arc |
Example
1 Create an arc between two tangents on the canvas
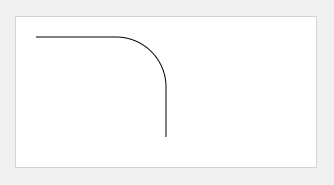
var c = document.getElementById("myCanvas");var ctx = c.getContext("2d");ctx.beginPath();ctx.moveTo(20, 20); // Create a starting pointctx.lineTo(100, 20); // Create a horizontal linectx.arcTo(150, 20, 150, 70, 50); // Create an arcctx.lineTo(150, 120); // Continue with vertical linectx.stroke(); // Draw it
isPointInPath()
Returns true if the specified point is in the current path, otherwise false
Definition and Usage
The isPointInPath() method returns true if the specified point is in the current path, otherwise false.
| JavaScript syntax: | context.isPointInPath(x,y); |
Parameter Values
| Parameter | Description |
|---|---|
| x | The x-coordinate to test |
| y | The y-coordinate to test |
Example
1 Draw a rectangle if the point 20,50 is in the current path
var c = document.getElementById("myCanvas");var ctx = c.getContext("2d");ctx.rect(20, 20, 150, 100);if (ctx.isPointInPath(20, 50)) {ctx.stroke();};
Transformations
| Method | Description |
|---|---|
| scale() | Scales the current drawing bigger or smaller |
| rotate() | Rotates the current drawing |
| translate() | Remaps the (0,0) position on the canvas |
| transform() | Replaces the current transformation matrix for the drawing |
| setTransform() | Resets the current transform to the identity matrix. Then runs transform() |
Method
scale()
Scales the current drawing bigger or smaller
scale
英 [skeɪl] 美 [skeɪl]
n. 规模;(尤指与其他事物相比较时的)范围;程度;等级;级别;等级体系
vt. 攀登;到达…顶点;去鳞;刮除牙石
Definition and Usage
The scale() method scales the current drawing, bigger or smaller.
Note: If you scale a drawing, all future drawings will also be scaled. The positioning will also be scaled. If you scale(2,2); drawings will be positioned twice as far from the left and top of the canvas as you specify.
| JavaScript syntax: | context.scale(scalewidth,scaleheight); |
Parameter Values
| Parameter | Description |
|---|---|
| scalewidth | Scales the width of the current drawing (1=100%, 0.5=50%, 2=200%, etc.) |
| scaleheight | Scales the height of the current drawing (1=100%, 0.5=50%, 2=200%, etc.) |
Example
1 Draw a rectangle, scale to 200%, draw rectangle again, scale to 200%, draw rectangle again, scale to 200%, draw rectangle again
var c = document.getElementById("myCanvas");var ctx = c.getContext("2d");ctx.strokeStyle="black";ctx.strokeRect(5, 5, 25, 15);ctx.strokeStyle="red";ctx.scale(2, 2);ctx.strokeRect(5, 5, 25, 15);ctx.strokeStyle="green";ctx.scale(2, 2);ctx.strokeRect(5, 5, 25, 15);ctx.strokeStyle="blue";ctx.scale(2, 2);ctx.strokeRect(5, 5, 25, 15);
rotate()
Rotates the current drawing
Definition and Usage
The rotate() method rotates the current drawing.
Note: The rotation will only affect drawings made AFTER the rotation is done.
| JavaScript syntax: | context.rotate(angle); |
Parameter Values
| Parameter | Description |
|---|---|
| angle | The rotation angle, in radians. To calculate from degrees to radians: degrees Math.PI/180. Example: to rotate 5 degrees, specify the following: 5 Math.PI/180 |
Example
1 Rotate the rectangle 20 degrees
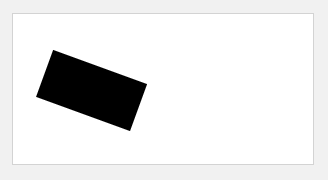
var c = document.getElementById("myCanvas");var ctx = c.getContext("2d");ctx.rotate(20 * Math.PI / 180);ctx.fillRect(50, 20, 100, 50);
translate()
Remaps the (0,0) position on the canvas
Definition and Usage
The translate() method remaps the (0,0) position on the canvas.
Note: When you call a method such as fillRect() after translate(), the value is added to the x- and y-coordinate values.
| JavaScript syntax: | context.translate(x,y); |
Parameter Values
Note: You can specify one or both parameters.
| Parameter | Description |
|---|---|
| x | The value to add to horizontal (x) coordinates |
| y | The value to add to vertical (y) coordinates |
Example
1 Draw a rectangle in position (10,10), set new (0,0) position to (70,70). Draw same rectangle again (notice that the rectangle now starts in position (80,80)
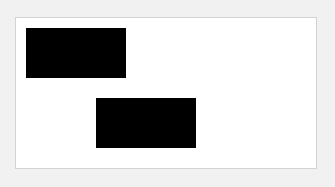
var c=document.getElementById("myCanvas");var ctx=c.getContext("2d");ctx.fillRect(10,10,100,50);ctx.translate(70,70);ctx.fillRect(10,10,100,50);
transform()
Replaces the current transformation matrix for the drawing
Definition and Usage
Each object on the canvas has a current transformation matrix.
The transform() method replaces the current transformation matrix. It multiplies the current transformation matrix with the matrix described by:
[ a c e b d f 0 0 1 ] \left[ \begin{array}{ccc} a & c & e \\ b & d & f \\ 0 & 0 & 1 \end{array} \right] ⎣⎡ab0cd0ef1⎦⎤
In other words, the transform() method lets you scale, rotate, move, and skew the current context.
Note: The transformation will only affect drawings made after the transform() method is called.
Note: The transform() method behaves relatively to other transformations made by rotate(), scale(), translate(), or transform(). Example: If you already have set your drawing to scale by two, and the transform() method scales your drawings by two, your drawings will now scale by four.
Tip: Check out the setTransform() method, which does not behave relatively to other transformations.
| JavaScript syntax: | context.transform(a,b,c,d,e,f); |
Parameter Values
| Parameter | Description |
|---|---|
| a | Scales the drawing horizontally |
| b | Skew the the drawing horizontally |
| c | Skew the the drawing vertically |
| d | Scales the drawing vertically |
| e | Moves the the drawing horizontally |
| f | Moves the the drawing vertically |
Example
1 Draw a rectangle, add a new transformation matrix with transform(), draw the rectangle again, add a new transformation matrix, then draw the rectangle again.
Notice that each time you call transform(), it builds on the previous transformation matrix
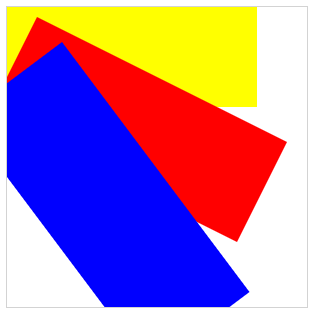
var c = document.getElementById("myCanvas");var ctx = c.getContext("2d");ctx.fillStyle = "yellow";ctx.fillRect(0, 0, 250, 100)ctx.transform(1, 0.5, -0.5, 1, 30, 10);ctx.fillStyle = "red";ctx.fillRect(0, 0, 250, 100);ctx.transform(1, 0.5, -0.5, 1, 30, 10);ctx.fillStyle = "blue";ctx.fillRect(0, 0, 250, 100);
setTransform()
Resets the current transform to the identity matrix. Then runs transform()
Definition and Usage
Each object on the canvas has a current transformation matrix.
The setTransform() method resets the current transform to the identity matrix, and then runs transform() with the same arguments.
In other words, the setTransform() method lets you scale, rotate, move, and skew the current context.
Note: The transformation will only affect drawings made after the setTransform method is called.
| JavaScript syntax: | context.transform(a,b,c,d,e,f); |
Parameter Values
| Parameter | Description |
|---|---|
| a | Scales the drawing horizontally |
| b | Skew the the drawing horizontally |
| c | Skew the the drawing vertically |
| d | Scales the drawing vertically |
| e | Moves the the drawing horizontally |
| f | Moves the the drawing vertically |
Example
1 Draw a rectangle, reset and create a new transformation matrix with setTransform(), draw the rectangle again, reset and create a new transformation matrix, then draw the rectangle again.
Notice that each time you call setTransform(), it resets the previous transformation matrix and then builds the new matrix, so in the example below, the red rectangle is not shown, because it is under the blue rectangle.
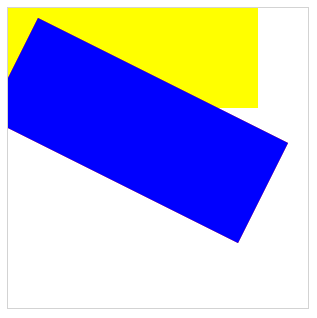
var c=document.getElementById("myCanvas");var ctx=c.getContext("2d");ctx.fillStyle="yellow";ctx.fillRect(0,0,250,100)ctx.setTransform(1,0.5,-0.5,1,30,10);ctx.fillStyle="red";ctx.fillRect(0,0,250,100);ctx.setTransform(1,0.5,-0.5,1,30,10);ctx.fillStyle="blue";ctx.fillRect(0,0,250,100);
PS.对比上文的transform()的Example对比理解。
Text
| Property | Description |
|---|---|
| font | Sets or returns the current font properties for text content |
| textAlign | Sets or returns the current alignment for text content |
| textBaseline | Sets or returns the current text baseline used when drawing text |
| Method | Description |
|---|---|
| fillText() | Draws “filled” text on the canvas |
| strokeText() | Draws text on the canvas (no fill) |
| measureText() | Returns an object that contains the width of the specified text |
Property
font
Sets or returns the current font properties for text content
Definition and Usage
The font property sets or returns the current font properties for text content on the canvas.
The font property uses the same syntax as the CSS font property.
| Default value: | 10px sans-serif |
| JavaScript syntax: | context.font=“italic small-caps bold 12px arial”; |
Property Values
| Values | Description |
|---|---|
| font-style | Specifies the font style. Possible values: normal, italic, oblique |
| font-variant | Specifies the font variant. Possible values:normal, small-caps |
| font-weight | Specifies the font weight. Possible values:normal, bold, bolder, lighter, 100, 200, 300, 400, 500, 600, 700, 800, 900 |
| font-size/line-height | Specifies the font size and the line-height, in pixels |
| font-family | Specifies the font family |
| caption | Use the font captioned controls (like buttons, drop-downs, etc.) |
| icon | Use the font used to label icons |
| menu | Use the font used in menus (drop-down menus and menu lists) |
| message-box | Use the font used in dialog boxes |
| small-caption | Use the font used for labeling small controls |
| status-bar | Use the fonts used in window status bar |
Example
1 Write a 30px high text on the canvas, using the font “Arial”
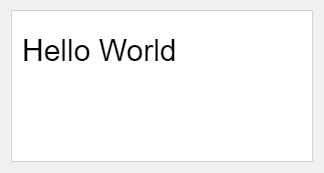
var c=document.getElementById("myCanvas");var ctx=c.getContext("2d");ctx.font="30px Arial";ctx.fillText("Hello World",10,50);
textAlign
Sets or returns the current alignment for text content
align
英 [əˈlaɪn] 美 [əˈlaɪn]
v. 排列;校准;排整齐;(尤指)使成一条直线;使一致
Definition and Usage
The textAlign property sets or returns the current alignment for text content, according to the anchor point.
Normally, the text will START in the position specified, however, if you set textAlign=“right” and place the text in position 150, it means that the text should END in position 150.
Tip: Use the fillText() or the strokeText() method to actually draw and position the text on the canvas.
| Default value: | start |
|---|---|
| JavaScript syntax: | context.textAlign=“center|end|left|right|start”; |
Property Values
| Values | Description |
|---|---|
| start | Default. The text starts at the specified position |
| end | The text ends at the specified position |
| center | The center of the text is placed at the specified position |
| left | The text starts at the specified position |
| right | The text ends at the specified position |
Example
1 Create a red line in position 150. Position 150 is the anchor point for all the text defined in the example below
Study the effect of each textAlign property value.
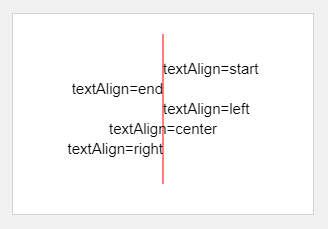
var c=document.getElementById("myCanvas");var ctx=c.getContext("2d");// Create a red line in position 150ctx.strokeStyle="red";ctx.moveTo(150,20);ctx.lineTo(150,170);ctx.stroke();ctx.font="15px Arial";// Show the different textAlign valuesctx.textAlign="start";ctx.fillText("textAlign=start",150,60);ctx.textAlign="end";ctx.fillText("textAlign=end",150,80);ctx.textAlign="left";ctx.fillText("textAlign=left",150,100);ctx.textAlign="center";ctx.fillText("textAlign=center",150,120);ctx.textAlign="right";ctx.fillText("textAlign=right",150,140);
textBaseline
Sets or returns the current text baseline used when drawing text
Definition and Usage
The textBaseline property sets or returns the current text baseline used when drawing text.
The illustration below demonstrates the various baselines supported by the textBaseline attribute:
Note: The fillText() and strokeText() methods will use the specified textBaseline value when positioning the text on the canvas.
| Default value: | alphabetic |
| JavaScript syntax: | context.textBaseline=“alphabetic|top|hanging|middle|ideographic|bottom”; |
Property Values
| Values | Description |
|---|---|
| alphabetic | Default. The text baseline is the normal alphabetic baseline |
| top | The text baseline is the top of the em square |
| hanging | The text baseline is the hanging baseline |
| middle | The text baseline is the middle of the em square |
| ideographic | The text baseline is the ideographic baseline |
| bottom | The text baseline is the bottom of the bounding box |
Example
1 Draw a red line at y=100, then place each word at y=100 with different textBaseline values
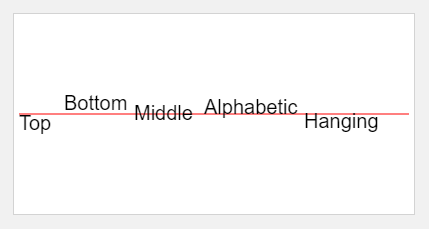
var c=document.getElementById("myCanvas");var ctx=c.getContext("2d");//Draw a red line at y=100ctx.strokeStyle="red";ctx.moveTo(5,100);ctx.lineTo(395,100);ctx.stroke();ctx.font="20px Arial"//Place each word at y=100 with different textBaseline valuesctx.textBaseline="top";ctx.fillText("Top",5,100);ctx.textBaseline="bottom";ctx.fillText("Bottom",50,100);ctx.textBaseline="middle";ctx.fillText("Middle",120,100);ctx.textBaseline="alphabetic";ctx.fillText("Alphabetic",190,100);ctx.textBaseline="hanging";ctx.fillText("Hanging",290,100);
Method
fillText()
Draws “filled” text on the canvas
Definition and Usage
The fillText() method draws filled text on the canvas. The default color of the text is black.
Tip: Use the font property to specify font and font size, and use the fillStyle property to render the text in another color/gradient.
| JavaScript syntax: | context.fillText(text,x,y,maxWidth); |
Parameter Values
| Parameter | Description |
|---|---|
| text | Specifies the text that will be written on the canvas |
| x | The x coordinate where to start painting the text (relative to the canvas) |
| y | The y coordinate where to start painting the text (relative to the canvas) |
| maxWidth | Optional. The maximum allowed width of the text, in pixels |
Example
1 Write “Hello world!” and “Big smile!” (with gradient) on the canvas, using fillText()
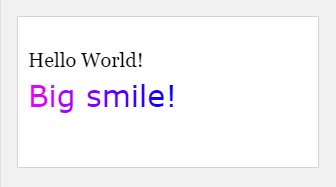
var c=document.getElementById("myCanvas");var ctx=c.getContext("2d");ctx.font="20px Georgia";ctx.fillText("Hello World!",10,50);ctx.font="30px Verdana";// Create gradientvar gradient=ctx.createLinearGradient(0,0,c.width,0);gradient.addColorStop("0","magenta");gradient.addColorStop("0.5","blue");gradient.addColorStop("1.0","red");// Fill with gradientctx.fillStyle=gradient;ctx.fillText("Big smile!",10,90);
strokeText()
Draws text on the canvas (no fill)
Definition and Usage
The strokeText() method draws text (with no fill) on the canvas. The default color of the text is black.
Tip: Use the font property to specify font and font size, and use the strokeStyle property to render the text in another color/gradient.
| JavaScript syntax: | context.strokeText(text,x,y,maxWidth); |
Parameter Values
| Parameter | Description |
|---|---|
| text | Specifies the text that will be written on the canvas |
| x | The x coordinate where to start painting the text (relative to the canvas) |
| y | The y coordinate where to start painting the text (relative to the canvas) |
| maxWidth | Optional. The maximum allowed width of the text, in pixels |
Example
1 Write “Hello world!” and “Big smile!” (with gradient) on the canvas, using strokeText()
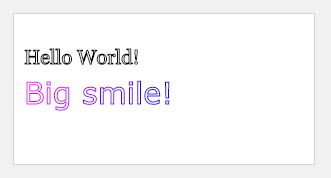
var c=document.getElementById("myCanvas");var ctx=c.getContext("2d");ctx.font="20px Georgia";ctx.strokeText("Hello World!",10,50);ctx.font="30px Verdana";// Create gradientvar gradient=ctx.createLinearGradient(0,0,c.width,0);gradient.addColorStop("0","magenta");gradient.addColorStop("0.5","blue");gradient.addColorStop("1.0","red");// Fill with gradientctx.strokeStyle=gradient;ctx.strokeText("Big smile!",10,90);
measureText()
Returns an object that contains the width of the specified text
Definition and Usage
The measureText() method returns an object that contains the width of the specified text, in pixels.
Tip: Use this method if you need to know the width of a text, before writing it on the canvas.
| JavaScript syntax: | context.measureText(text).width; |
Parameter Values
| Parameter | Description |
|---|---|
| text | The text to be measured |
Example
1 Check the width of the text, before writing it on the canvas

var c=document.getElementById("myCanvas");var ctx=c.getContext("2d");ctx.font="30px Arial";var txt="Hello World"ctx.fillText("width:" + ctx.measureText(txt).width,10,50)ctx.fillText(txt,10,100);
Image Drawing
| Method | Description |
|---|---|
| drawImage() | Draws an image, canvas, or video onto the canvas |
Method
drawImage()
Draws an image, canvas, or video onto the canvas
Definition and Usage
The drawImage() method draws an image, canvas, or video onto the canvas.
The drawImage() method can also draw parts of an image, and/or increase/reduce the image size.
Note: You cannot call the drawImage() method before the image has loaded. To ensure that the image has been loaded, you can call drawImage() from window.onload() or from document.getElementById(“imageID”).onload.
JavaScript Syntax
Position the image on the canvas:
| JavaScript syntax: | context.drawImage(img,x,y); |
Position the image on the canvas, and specify width and height of the image:
| JavaScript syntax: | context.drawImage(img,x,y,width,height); |
Clip the image and position the clipped part on the canvas:
| JavaScript syntax: | context.drawImage(img,sx,sy,swidth,sheight,x,y,width,height); |
Parameter Values
| Parameter | Description |
|---|---|
| img | Specifies the image, canvas, or video element to use |
| sx | Optional. The x coordinate where to start clipping |
| sy | Optional. The y coordinate where to start clipping |
| swidth | Optional. The width of the clipped image |
| sheight | Optional. The height of the clipped image |
| x | The x coordinate where to place the image on the canvas |
| y | The y coordinate where to place the image on the canvas |
| width | Optional. The width of the image to use (stretch or reduce the image) |
| height | Optional. The height of the image to use (stretch or reduce the image) |
Example
1 Draw the image onto the canvas
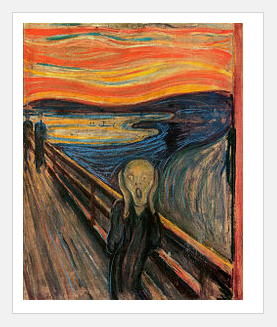
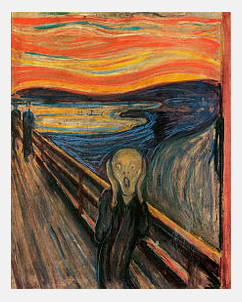
window.onload = function() {var c=document.getElementById("myCanvas");var ctx=c.getContext("2d");var img=document.getElementById("scream");ctx.drawImage(img,10,10);};
2 Position the image on the canvas, and specify width and height of the image
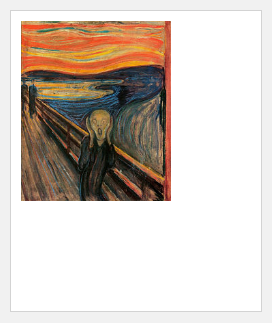
window.onload = function() {var c=document.getElementById("myCanvas");var ctx=c.getContext("2d");var img=document.getElementById("scream");ctx.drawImage(img,10,10,150,180);};
3 Clip the image and position the clipped part on the canvas
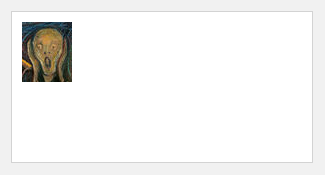
window.onload = function() {var c=document.getElementById("myCanvas");var ctx=c.getContext("2d");var img=document.getElementById("scream");ctx.drawImage(img,90,130,50,60,10,10,50,60);};
4 draws the current frame of the video every 20 millisecond
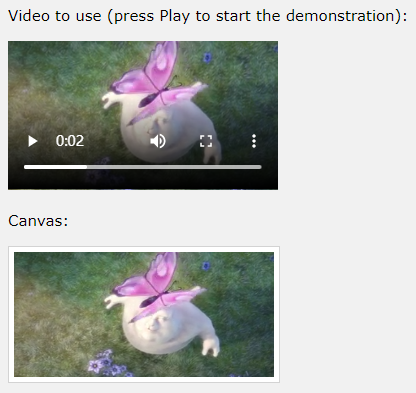
var v=document.getElementById("video1");var c=document.getElementById("myCanvas");var ctx=c.getContext('2d');var i;v.addEventListener('play',function() { i=window.setInterval(function() { ctx.drawImage(v,5,5,260,125)},20);},false);v.addEventListener('pause',function() { window.clearInterval(i);},false);v.addEventListener('ended',function() { clearInterval(i);},false);
Pixel Manipulation
| Property | Description |
|---|---|
| width | Returns the width of an ImageData object |
| height | Returns the height of an ImageData object |
| data | Returns an object that contains image data of a specified ImageData object |
| Method | Description |
|---|---|
| createImageData() | Creates a new, blank ImageData object |
| getImageData() | Returns an ImageData object that copies the pixel data for the specified rectangle on a canvas |
| putImageData() | Puts the image data (from a specified ImageData object) back onto the canvas |
Property
width
Returns the width of an ImageData object
Definition and Usage
The width property returns the width of an ImageData object, in pixels.
Tip: Look at createImageData(), getImageData(), and putImageData() to learn more about the ImageData object.
JavaScript Syntax
| JavaScript syntax: | imgData.width; |
Example
略
height
Returns the height of an ImageData object
Definition and Usage
The height property returns the height of an ImageData object, in pixels.
Tip: Look at createImageData(), getImageData(), and putImageData() to learn more about the ImageData object.
JavaScript Syntax
| JavaScript syntax: | imgData.height; |
Example
略
data
Returns an object that contains image data of a specified ImageData object
Definition and Usage
The data property returns an object that contains image data of the specified ImageData object.
For every pixel in an ImageData object there are four pieces of information, the RGBA values:
- R - The color red (from 0-255)
- G - The color green (from 0-255)
- B - The color blue (from 0-255)
- A - The alpha channel (from 0-255; 0 is transparent and 255 is fully visible)
The color/alpha information is held in an array, and is stored in the data property of the ImageData object.
Examples:
The syntax for making the first pixel in the ImageData object red:
imgData=ctx.createImageData(100,100);imgData.data[0]=255;imgData.data[1]=0;imgData.data[2]=0;imgData.data[3]=255;
The syntax for making the second pixel in the ImageData object green:
imgData=ctx.createImageData(100,100);imgData.data[4]=0;imgData.data[5]=255;imgData.data[6]=0;imgData.data[7]=255;
Tip: Look at createImageData(), getImageData(), and putImageData() to learn more about the ImageData object.
JavaScript Syntax
| JavaScript syntax: | imageData.data; |
Example
略
Method
createImageData()
Creates a new, blank ImageData object
Definition and Usage
The createImageData() method creates a new, blank ImageData object. The new object’s pixel values are transparent black by default.
For every pixel in an ImageData object there are four pieces of information, the RGBA values:
- R - The color red (from 0-255)
- G - The color green (from 0-255)
- B - The color blue (from 0-255)
- A - The alpha channel (from 0-255; 0 is transparent and 255 is fully visible)
So, transparent black indicates: (0,0,0,0).
The color/alpha information is held in an array, and since the array contains 4 pieces of information for every pixel, the array’s size is 4 times the size of the ImageData object: widthheight4. (An easier way to find the size of the array, is to use ImageDataObject.data.length)
The array containing the color/alpha information is stored in the data property of the ImageData object.
Tip: After you have manipulated the color/alpha information in the array, you can copy the image data back onto the canvas with the putImageData() method.
Examples:
The syntax for making the first pixel in the ImageData object red:
imgData=ctx.createImageData(100,100);imgData.data[0]=255;imgData.data[1]=0;imgData.data[2]=0;imgData.data[3]=255;
The syntax for making the second pixel in the ImageData object green:
imgData=ctx.createImageData(100,100);imgData.data[4]=0;imgData.data[5]=255;imgData.data[6]=0;imgData.data[7]=255;
JavaScript Syntax
There are two versions of the createImageData() method:
1.This creates a new ImageData object with the specified dimensions (in pixels):
| JavaScript syntax: | var imgData=context.createImageData(width,height); |
2.This creates a new ImageData object with the same dimensions as the object specified by anotherImageData (this does not copy the image data):
| JavaScript syntax: | var imgData=context.createImageData(imageData); |
Parameter Values
| Parameter | Description |
|---|---|
| width | The width of the new ImageData object, in pixels |
| height | The height of the new ImageData object, in pixels |
| imageData | anotherImageData object |
Example
1 Create a 100*100 pixels ImageData object, and put it onto the canvas:
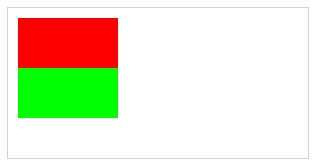
var c = document.getElementById("myCanvas");var ctx = c.getContext("2d");var imgData = ctx.createImageData(100, 100);var i;for (i = 0; i < imgData.data.length / 2; i += 4) {imgData.data[i+0] = 255;imgData.data[i+1] = 0;imgData.data[i+2] = 0;imgData.data[i+3] = 255;}for (i = imgData.data.length / 2; i < imgData.data.length; i += 4) {imgData.data[i+0] = 0;imgData.data[i+1] = 255;imgData.data[i+2] = 0;imgData.data[i+3] = 255;}ctx.putImageData(imgData, 10, 10);
getImageData()
Returns an ImageData object that copies the pixel data for the specified rectangle on a canvas
Definition and Usage
The getImageData() method returns an ImageData object that copies the pixel data for the specified rectangle on a canvas.
Note: The ImageData object is not a picture, it specifies a part (rectangle) on the canvas, and holds information of every pixel inside that rectangle.
For every pixel in an ImageData object there are four pieces of information, the RGBA values:
- R - The color red (from 0-255)
- G - The color green (from 0-255)
- B - The color blue (from 0-255)
- A - The alpha channel (from 0-255; 0 is transparent and 255 is fully visible)
The color/alpha information is held in an array, and is stored in the data property of the ImageData object.
Tip: After you have manipulated the color/alpha information in the array, you can copy the image data back onto the canvas with the putImageData() method.
Example:
The code for getting color/alpha information of the first pixel in the returned ImageData object:
red=imgData.data[0];green=imgData.data[1];blue=imgData.data[2];alpha=imgData.data[3];
Tip: You can also use the getImageData() method to invert the color of every pixels of an image on the canvas.
Loop through all the pixels and change the color values using this formula:
red=255-old_red;green=255-old_green;blue=255-old_blue;
See below for a try it yourself example!
JavaScript Syntax
| JavaScript syntax: | context.getImageData(x,y,width,height); |
Parameter Values
| Parameter | Description |
|---|---|
| x | The x coordinate (in pixels) of the upper-left corner to start copy from |
| y | The y coordinate (in pixels) of the upper-left corner to start copy from |
| width | The width of the rectangular area you will copy |
| height | The height of the rectangular area you will copy |
Example
1 Use getImageData() to invert the color of every pixels of an image on the canvas
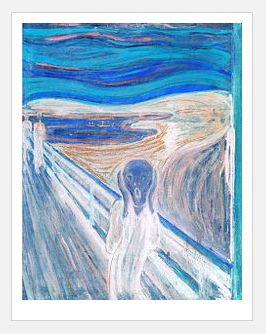
var c=document.getElementById("myCanvas");var ctx=c.getContext("2d");var img=document.getElementById("scream");ctx.drawImage(img,0,0);var imgData=ctx.getImageData(0,0,c.width,c.height);// invert colorsfor (var i=0;i<imgData.data.length;i+=4){imgData.data[i]=255-imgData.data[i];imgData.data[i+1]=255-imgData.data[i+1];imgData.data[i+2]=255-imgData.data[i+2];imgData.data[i+3]=255;}ctx.putImageData(imgData,0,0);
putImageData()
Puts the image data (from a specified ImageData object) back onto the canvas
Definition and Usage
The putImageData() method puts the image data (from a specified ImageData object) back onto the canvas.
Tip: Read about the getImageData() method that copies the pixel data for a specified rectangle on a canvas.
Tip: Read about the createImageData() method that creates a new, blank ImageData object.
JavaScript Syntax
| JavaScript syntax: | context.putImageData(imgData,x,y,dirtyX,dirtyY,dirtyWidth,dirtyHeight); |
Parameter Values
| Parameter | Description |
|---|---|
| imgData | Specifies the ImageData object to put back onto the canvas |
| x | The x-coordinate, in pixels, of the upper-left corner of the ImageData object |
| y | The y-coordinate, in pixels, of the upper-left corner of the ImageData object |
| dirtyX | Optional. The horizontal (x) value, in pixels, where to place the image on the canvas |
| dirtyY | Optional. The vertical (y) value, in pixels, where to place the image on the canvas |
| dirtyWidth | Optional. The width to use to draw the image on the canvas |
| dirtyHeight | Optional. The height to use to draw the image on the canvas |
Example
1 putImageData() with optional parameter
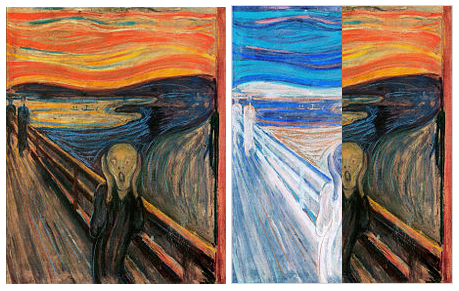
<img id="scream" src="img_the_scream.jpg" alt="The Scream" width="220" height="277"><canvas id="myCanvas" width="220" height="277" style="border:1px solid #d3d3d3;">Your browser does not support the HTML5 canvas tag.</canvas><script> document.getElementById("scream").onload = function() { var c = document.getElementById("myCanvas"); var ctx = c.getContext("2d"); var img = document.getElementById("scream"); ctx.drawImage(img, 0, 0); var imgData = ctx.getImageData(0, 0, c.width, c.height); // invert colors var i; for (i = 0; i < imgData.data.length; i += 4) { imgData.data[i] = 255 - imgData.data[i]; imgData.data[i+1] = 255 - imgData.data[i+1]; imgData.data[i+2] = 255 - imgData.data[i+2]; imgData.data[i+3] = 255; } ctx.putImageData(imgData, 0, 0, 0, 0, 110, 277); }; </script>
Compositing
| Property | Description |
|---|---|
| globalAlpha | Sets or returns the current alpha or transparency value of the drawing |
| globalCompositeOperation | Sets or returns how a new image are drawn onto an existing image |
Property
globalAlpha
Sets or returns the current alpha or transparency value of the drawing
Definition and Usage
The globalAlpha property sets or returns the current alpha or transparency value of the drawing.
The globalAlpha property value must be a number between 0.0 (fully transparent) and 1.0 (no transparancy).
| Default value: | 1.0 |
| JavaScript syntax: | context.globalAlpha=number; |
Property Values
| Value | Description |
|---|---|
| number | The transparency value. Must be a number between 0.0 (fully transparent) and 1.0 (no transparancy) |
Example
1 First, draw a red rectangle, then set transparency (globalAlpha) to 0.5, and then draw a blue and a green rectangle
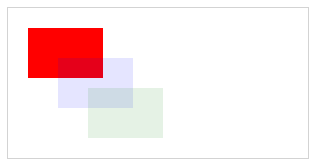
var c = document.getElementById("myCanvas");var ctx = c.getContext("2d");ctx.fillStyle = "red";ctx.fillRect(20, 20, 75, 50);//Turn transparency onctx.globalAlpha = 0.1;ctx.fillStyle = "blue";ctx.fillRect(50, 50, 75, 50);ctx.fillStyle = "green";ctx.fillRect(80, 80, 75, 50);
globalCompositeOperation
Sets or returns how a new image are drawn onto an existing image
Definition and Usage
The globalCompositeOperation property sets or returns how a source (new) image are drawn onto a destination (existing) image.
source image = drawings you are about to place onto the canvas.
destination image = drawings that are already placed onto the canvas.
| Default value: | source-over |
| JavaScript syntax: | context.globalCompositeOperation=“source-in”; |
Property Values
| Value | Description |
|---|---|
| source-over | Default. Displays the source image over the destination image |
| source-atop | Displays the source image on top of the destination image. The part of the source image that is outside the destination image is not shown |
| source-in | Displays the source image in to the destination image. Only the part of the source image that is INSIDE the destination image is shown, and the destination image is transparent |
| source-out | Displays the source image out of the destination image. Only the part of the source image that is OUTSIDE the destination image is shown, and the destination image is transparent |
| destination-over | Displays the destination image over the source image |
| destination-atop | Displays the destination image on top of the source image. The part of the destination image that is outside the source image is not shown |
| destination-in | Displays the destination image in to the source image. Only the part of the destination image that is INSIDE the source image is shown, and the source image is transparent |
| destination-out | Displays the destination image out of the source image. Only the part of the destination image that is OUTSIDE the source image is shown, and the source image is transparent |
| lighter | Displays the source image + the destination image |
| copy | Displays the source image. The destination image is ignored |
| xor | The source image is combined by using an exclusive OR with the destination image |
Example
1 All the globalCompositeOperation property values
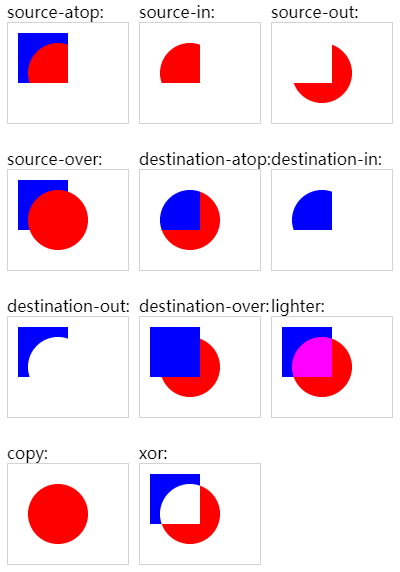
var gco = new Array();gco.push("source-atop");gco.push("source-in");gco.push("source-out");gco.push("source-over");gco.push("destination-atop");gco.push("destination-in");gco.push("destination-out");gco.push("destination-over");gco.push("lighter");gco.push("copy");gco.push("xor");var n;for (n = 0; n < gco.length; n++) {document.write("<div id='p_" + n + "' style='float:left;'>" + gco[n] + ":<br>");var c = document.createElement("canvas");c.width = 120;c.height = 100;document.getElementById("p_" + n).appendChild(c);var ctx = c.getContext("2d");ctx.fillStyle = "blue";ctx.fillRect(10, 10, 50, 50);ctx.globalCompositeOperation = gco[n];ctx.beginPath();ctx.fillStyle = "red";ctx.arc(50, 50, 30, 0, 2 * Math.PI);ctx.fill();document.write("</div>");}
Other
| Method | Description |
|---|---|
| save() | Saves the state of the current context (Push the current state on the state stack) |
| restore() | Returns previously saved path state and attributes (Remove the top state from the state stack and thus restore the previous state that was pushed on the state stack) |
| getContext() | Returns the so-called context, i.e. an object that exposes an API for drawing on the canvas. |
| toDataURL() | Returns a ‘data:’ URL for the image in the canvas |
Method
save()
Definition and Usage
Push the current state on the state stack.
A drawing state is the set of the current settings of a CanvasRenderingContext2D object. It includes:
- the current style values (strokeStyle and fillStyle),
- globalAlpha and globalCompositeOperation,
- the line (lineWidth, lineCap, lineJoin, miterLimit),
- shadow (shadowOffsetX, shadowOffsetY, shadowBlur, shadowColor)
- text settings (font, textAlign, textBaseline),
- the current clipping region
- the current transformation matrix.
Each CanvasRenderingContext2D object maintains a stack of drawing states. And with save() and restore(), drawing states can be pushed onto this stack and recovered at a later point.
Note, that the drawing state does not include the current path or bitmaps. So save() and restore() do not save and restore entire canvas pictures, i.e. entire contents of the given context. For that, you should use ImageData objects and the getImageData() and putImageData() methods (see the chapter on pixel manipulation).
Example
1 save() and restore()
Suppose we draw 5 figures, each one a fillRect() rectangle with two lines of strokeText() text in it, like so:
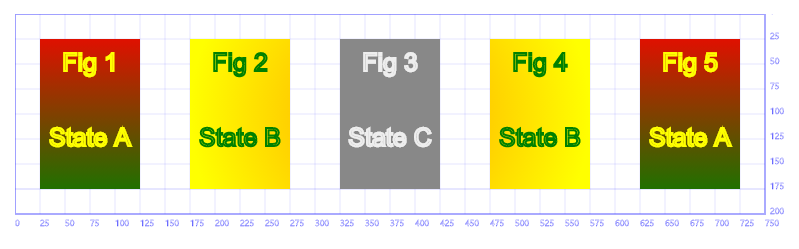
As it is apparent from the picture, we use 3 different style settings for the 5 figures, defined as states:
- State A with a linear gradient fillStyle, running from top red to bottom green and yellow strokeStyle.
- State B with a radial gradient fillStyle, running from a orange center start to an outer green end circle and green strokeStyle.
- State C with dark gray fillStyle and light gray strokeStyle.
We could generate the previous canvas by following these steps:
- declare State A and draw Figure 1 and 5
- declare State B and draw Figure 2 and 4
- declare State C and draw Figure 3
But since we want to demonstrate the use of save() and restore(), we create the Figures in their presented order:
- set State A, draw Figure 1 and save State A on the state stack
- set State B, draw Figure 2 and save State B on the state stack
- set State C and draw Figure 3
- overwrite State C by restoring State B from the stack and draw Figure 4
- restore State A and draw Figure 5
The full source code that actually generated the canvas is this:
// Text style settings (these will be part of Start A, B, and C alike, because they do not change)context.textAlign = 'center';context.textBaseline = 'middle';context.lineWidth = 2.0;context.font = '25px Arial';// Settings for State Avar verticalGrad = context.createLinearGradient (0,0,0,200);verticalGrad.addColorStop (0,'red');verticalGrad.addColorStop (1,'green');context.fillStyle = verticalGrad;context.strokeStyle = 'yellow';// Draw Figure 1context.fillRect (25,25,100,150);context.strokeText ("Fig 1",75,50);context.strokeText ("State A", 75,125);// Save State Acontext.save();// Settings for State Bvar radGrad = context.createRadialGradient (375,100,5, 375,100,200);radGrad.addColorStop (0,'orange');radGrad.addColorStop (1,'yellow');context.fillStyle = radGrad;context.strokeStyle = 'green';// Draw Figure 2context.fillRect (175,25,100,150);context.strokeText ("Fig 2",225,50);context.strokeText ("State B",225,125);// Save State Bcontext.save();// Settings for State Ccontext.fillStyle = '#888888';context.strokeStyle = '#EEEEEE';// Draw Figure 3context.fillRect (325,25,100,150);context.strokeText ("Fig 3",375,50);context.strokeText ("State C",375,125);// Pop State C and restore State Bcontext.restore();// Draw Figure 4context.fillRect (475,25,100,150);context.strokeText ("Fig 4",525,50);context.strokeText ("State B",525,125);// Pop state B and restore state Acontext.restore();// Draw Figure 5context.fillRect (625,25,100,150);context.strokeText ("Fig 5",675,50);context.strokeText ("State A",675,125);
restore()
Remove the top state from the state stack and thus restore the previous state that was pushed on the state stack.
Example
参考上文save()的Example
getContext()
HTMLCanvasElement.getContext (contextId)
returns the so-called context, i.e. an object that exposes an API for drawing on the canvas. Currently, only the CanvasRenderingContext2D object is supported, and for that the contextId is ‘2d’. The result of this call will be null if the given context ID is not supported.
This context, which will always be the 2D context in the sequel, is attached to the canvas and accessible by a call of canvas.getContext(‘2d’). This context is where all the action takes place. It provides the interface for all the drawings added to the given canvas and explaining the CanvasRenderingContext2D object below is thus the biggest part of this manual.
The [W3C] document announces that there will probably be a ‘3d’ context in the future, based on the OpenGL ES API.
Example
略
toDataURL()
Returns a data: URL for the image in the canvas. The first optional type argument controls the type of the image to be returned (e.g. PNG or JPEG). The default type is ‘image/png’ for PNG images. The other arguments are specific to the type and control the way that the image is generated.
Example
1 Convert the canvas into a data URL
Let us consider a very tiny canvas example, say a red 20x20 pixel rectangle

generated by the following code
<canvas id="DataUrlSample" width=20 height=20></canvas><script> var canvas = document.getElementById ('DataUrlSample'); var context = canvas.getContext ('2d'); context.fillStyle = 'red'; context.fillRect (0, 0, 20, 20); </script>
We can now convert the canvas into a PNG data URL by calling:
var dataUrl = canvas.toDataURL();
and dataUrl now holds this string:
data:image/png;base64,iVBORw0KGgoAAAANSUhEUgAAABQAAAAUCAYAAACNiR0NAAAAK0lEQVQ4T2P8z8Dwn4GKgHHUQIpDczQMKQ5ChtEwHA1DMkJgNNmQEWhoWgBMAiftPRtHngAAAABJRU5ErkJggg==
If you copy this string and put it into the address field of your browser, you should see the picture of the red square.
We can also convert to a JPEG like so
var dataUrl = canvas.toDataURL('image/jpeg');
and then the result is this string:
data:image/jpeg;base64,/9j/4AAQSkZJRgABAQAAAQABAAD/2wBDAAMCAgICAgMCAgIDAwMDBAYEBAQEBAgGBgUGCQgKCgkICQkKDA8MCgsOCwkJDRENDg8QEBEQCgwSExIQEw8QEBD/2wBDAQMDAwQDBAgEBAgQCwkLEBAQEBAQEBAQEBAQEBAQEBAQEBAQEBAQEBAQEBAQEBAQEBAQEBAQEBAQEBAQEBAQEBD/wAARCAAUABQDASIAAhEBAxEB/8QAFQABAQAAAAAAAAAAAAAAAAAAAAj/xAAUEAEAAAAAAAAAAAAAAAAAAAAA/8QAFgEBAQEAAAAAAAAAAAAAAAAAAAcJ/8QAFBEBAAAAAAAAAAAAAAAAAAAAAP/aAAwDAQACEQMRAD8AnQBDGqYAAAAAD//Z
You can copy all this and call it in your browser to get the little red square, again.
For a more convenient solution, we can attach these lines to the previous code:
canvas.onclick = function () {window.location = canvas.toDataURL('image/png');};
If we then click on the canvas, the browser opens the data URL into the address field and thus shows the image. And then, the user can choose to save this image as a PNG file.


")


![[已解决]curl: (1) Protocol “https“ not supported or disabled in libcurl](https://image.dandelioncloud.cn/images/20221024/73a5a4f6d692447c83d0d737a4221ec2.png "[已解决]curl: (1) Protocol “https“ not supported or disabled in libcurl")


还没有评论,来说两句吧...