arcgis js(九)地理处理任务 缓冲区分析
1、基于上一节的讲解我们已经知道如何发布GP服务,arcgis js(九)地理处理任务0 发布GP服务_郝大大的博客-CSDN博客,接下来进入正题,后面会分节介绍如何进行调用和处理众多的地理任务,给从事本专业的高校学生或者对GIS感兴趣的开发者提供一个学习思路,满足大家对地理信息处理的迫切需求。
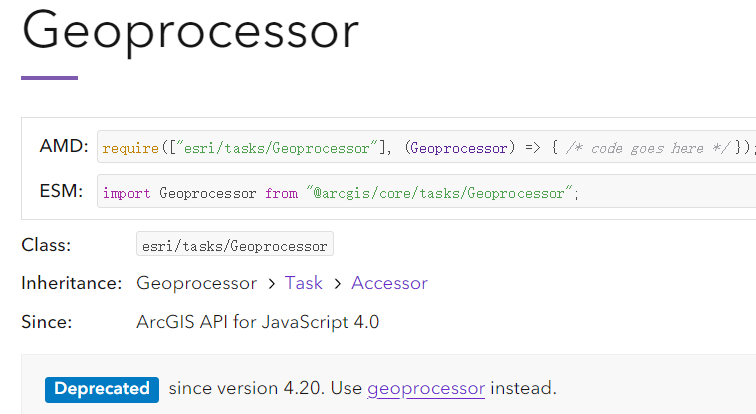
2、在查看了各种资料后发现esri在api提供了两种方式,一个是Geoprocessor,位于esri/tasks,另一个是geoprocessor,位于esri/rest,我们来看看它们的区别: Geoprocessor自从4.0版本后支持,但是自从4.20版本之后被舍弃掉了,geoprocessor自从4.19版本后支持,所以根据版本自行选择。

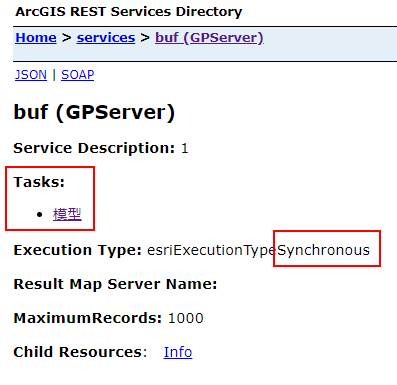
3、依然是基于天地图底图,我们分别介绍synchronous同步和asynchronous异步执行方法,显示速度和网速也有关系。同步的url是http://localhost:6080/arcgis/rest/services/buf/GPServer,在浏览器打开,可以看到执行方式,同时要注意Tasks:模型,在调用的时候一定要加上任务的名字,否则会失败,在代码中设置的url为:http://localhost:6080/arcgis/rest/services/buf/GPServer/模型
4、同步方法
<html><head><meta charset="utf-8" /><meta name="viewport" content="initial-scale=1,maximum-scale=1,user-scalable=no" /><title> Geoprocessing </title><style>html,body,#viewDiv {padding: 0;margin: 0;height: 100%;width: 100%;}#paneDiv {position: absolute;top: 18px;right: 18px;padding: 12px;background-color: rgba(0, 0, 0, 0.5);color: white;width: 200px;}</style><link rel="stylesheet" href="https://js.arcgis.com/4.20/esri/themes/light/main.css" /><script src="https://js.arcgis.com/4.20/"></script><script>require(["esri/Map","esri/views/MapView","esri/layers/GraphicsLayer","esri/Graphic","esri/geometry/Point","esri/rest/geoprocessor","esri/rest/support/LinearUnit","esri/rest/support/FeatureSet","esri/layers/WebTileLayer","esri/layers/support/TileInfo","esri/geometry/SpatialReference",], (Map,MapView,GraphicsLayer,Graphic,Point,geoprocessor,LinearUnit,FeatureSet,WebTileLayer,TileInfo,SpatialReference) => {var tiandituBaseUrl = "http://{subDomain}.tianditu.com"; //天地图服务地址var token = ""; //天地图token,在官网申请var tileInfo = new TileInfo({"rows": 256,"cols": 256,"origin": {"x": -180,"y": 90},"spatialReference": {"wkid": 4490},"lods": [{ "level": "1", "scale": 295829355.45, "resolution": 0.703125 },{ "level": "2", "scale": 147914677.725, "resolution": 0.3515625 },{ "level": "3", "scale": 73957338.8625, "resolution": 0.17578125 },{ "level": "4", "scale": 36978669.43125, "resolution": 0.087890625 },{ "level": "5", "scale": 18489334.715625, "resolution": 0.0439453125 },{ "level": "6", "scale": 9244667.3578125, "resolution": 0.02197265625 },{ "level": "7", "scale": 4622333.67890625, "resolution": 0.010986328125 },{ "level": "8", "scale": 2311166.839453125, "resolution": 0.0054931640625 },{ "level": "9", "scale": 1155583.4197265625, "resolution": 0.00274658203125 },{ "level": "10", "scale": 577791.7098632812, "resolution": 0.001373291015625 },{ "level": "11", "scale": 288895.8549316406, "resolution": 0.0006866455078125 },{ "level": "12", "scale": 144447.9274658203, "resolution": 0.00034332275390625 },{ "level": "13", "scale": 72223.96373291015, "resolution": 0.000171661376953125 },{ "level": "14", "scale": 36111.98186645508, "resolution": 0.0000858306884765625 },{ "level": "15", "scale": 18055.99093322754, "resolution": 0.00004291534423828125 },{ "level": "16", "scale": 9027.99546661377, "resolution": 0.000021457672119140625 },{ "level": "17", "scale": 4513.997733306885, "resolution": 0.000010728836059570312 },{ "level": "18", "scale": 2256.9988666534423, "resolution": 0.000005364418029785156 },{ "level": "19", "scale": 1128.4994333267211, "resolution": 0.000002682209014892578 }]});//影像地图var tdtImageLayer = new WebTileLayer({urlTemplate: tiandituBaseUrl + "/DataServer?T=img_c&x={col}&y={row}&l={level}&tk=" + token,subDomains: ["t0", "t1", "t2", "t3", "t4", "t5", "t6", "t7"],tileInfo: tileInfo,spatialReference: { wkid: 4490 },});//影像注记var tdtAnnoImageLayer = new WebTileLayer({urlTemplate: tiandituBaseUrl + "/DataServer?T=cia_c&x={col}&y={row}&l={level}&tk=" + token,subDomains: ["t0", "t1", "t2", "t3", "t4", "t5", "t6", "t7"],tileInfo: tileInfo,spatialReference: { wkid: 4490 },});const gpUrl = "http://localhost:6080/arcgis/rest/services/buf/GPServer/模型";//定位到济南市中心var cityCenter = new Point(116.985, 36.671, new SpatialReference({ wkid: 4490 }));// 创建地图var map = new Map({basemap: {baseLayers: [tdtImageLayer, tdtAnnoImageLayer]},});//添加到viewvar view = new MapView({container: "viewDiv",map: map,center: cityCenter,zoom: 14,ui: {components: ["zoom", "compass"]}});//创建显示图层const graphicsLayer = new GraphicsLayer();map.add(graphicsLayer);//创建点符号样式const markerSymbol = {type: "simple-marker",color: [255, 0, 0],outline: {color: [255, 255, 255],width: 2}};//创建面符号样式const fillSymbol = {type: "simple-fill",color: [226, 119, 40, 0.75],outline: {color: [255, 255, 255],width: 1},};//输出参考const options = {outSpatialReference: {wkid: 4490}};//单击事件view.on("click", computeViewshed);function computeViewshed(event) {graphicsLayer.removeAll();const point = new Point({longitude: event.mapPoint.longitude,latitude: event.mapPoint.latitude});const inputGraphic = new Graphic({geometry: point,symbol: markerSymbol});graphicsLayer.add(inputGraphic);//设置输入数据集const inputGraphicContainer = [];inputGraphicContainer.push(inputGraphic);const featureSet = new FeatureSet();featureSet.features = inputGraphicContainer;//设置缓冲区距离const dis = new LinearUnit();dis.distance = 100;dis.units = "meters";const params = {input: featureSet,dis: dis};//执行gp taskgeoprocessor.execute(gpUrl, params, options).then(drawResultData);}//执行结果function drawResultData(result) {const resultFeatures = result.results[0].value.features;//显示缓冲区const graphic = resultFeatures.map((feature) => {feature.symbol = fillSymbol;return feature;});graphicsLayer.addMany(graphic);view.goTo({target: graphic,tilt: 0}).catch((error) => {if (error.name != "AbortError") {console.error(error);}});}});</script></head><body><div id="viewDiv"></div><div id="paneDiv" class="esri-widget">在地图上单击执行 GP Task</div></body></html>

5、异步方法
打开链接http://localhost:6080/arcgis/rest/services/bufferpoint/GPServer可以看到执行类型是异步的:


![[MySQL FAQ]系列-net_buffer_length选项对数据备份及恢复影响](https://image.dandelioncloud.cn/images/20221120/d54048ba14da4535a7e4d0d10ba1a5d8.png "[MySQL FAQ]系列-net_buffer_length选项对数据备份及恢复影响")
")


—— 线程机制与事件机制")


还没有评论,来说两句吧...