Echarts教程_1-2 简介
https://gitee.com/fakerlove/echarts
文章目录
- echarts 教程
- 简介
- 入门
- 2.1 环境准备
- 2.2 入门demo
- 基础设置
- 2.3 echarts 使用
- 下载并引入echarts.js
- 准备一个具备大小的盒子
- 初始化echarts 实例对象
- 制定配置项和数据
- 将配置项设置给echarts 实例对象
echarts 教程
1. 简介
由百度 ECharts 团队创建,联合公司内外众多数据可视化从业人组成的技术研究虚拟组织,致力于数据可视化的相关研究、教育普及、产品研发及生态建设。
2. 入门
2.1 环境准备
flexible.js+rem 智能大屏适配
flexible 是阿里出品的屏幕适配。
https://github.com/amfe/lib-flexible
引用js的话
https://github.com/amfe/lib-flexible/blob/2.0/index.js
具体例子
(function flexible(window, document) {var docEl = document.documentElement;var dpr = window.devicePixelRatio || 1;// adjust body font sizefunction setBodyFontSize() {if (document.body) {document.body.style.fontSize = 12 * dpr + "px";} else {document.addEventListener("DOMContentLoaded", setBodyFontSize);}}setBodyFontSize();// set 1rem = viewWidth / 10function setRemUnit() {var rem = docEl.clientWidth / 24;docEl.style.fontSize = rem + "px";}setRemUnit();// reset rem unit on page resizewindow.addEventListener("resize", setRemUnit);window.addEventListener("pageshow", function(e) {if (e.persisted) {setRemUnit();}});// detect 0.5px supportsif (dpr >= 2) {var fakeBody = document.createElement("body");var testElement = document.createElement("div");testElement.style.border = ".5px solid transparent";fakeBody.appendChild(testElement);docEl.appendChild(fakeBody);if (testElement.offsetHeight === 1) {docEl.classList.add("hairlines");}docEl.removeChild(fakeBody);}})(window, document);
vscode cssrem插件

flex 布局
less 使用
把less 编译成css插件
2.2 入门demo
基础设置
flexible.js
(function flexible(window, document) {var docEl = document.documentElement;var dpr = window.devicePixelRatio || 1;// adjust body font sizefunction setBodyFontSize() {if (document.body) {document.body.style.fontSize = 12 * dpr + "px";} else {document.addEventListener("DOMContentLoaded", setBodyFontSize);}}setBodyFontSize();// set 1rem = viewWidth / 10function setRemUnit() {var rem = docEl.clientWidth / 24;docEl.style.fontSize = rem + "px";}setRemUnit();// reset rem unit on page resizewindow.addEventListener("resize", setRemUnit);window.addEventListener("pageshow", function(e) {if (e.persisted) {setRemUnit();}});// detect 0.5px supportsif (dpr >= 2) {var fakeBody = document.createElement("body");var testElement = document.createElement("div");testElement.style.border = ".5px solid transparent";fakeBody.appendChild(testElement);docEl.appendChild(fakeBody);if (testElement.offsetHeight === 1) {docEl.classList.add("hairlines");}docEl.removeChild(fakeBody);}})(window, document);
页面基础
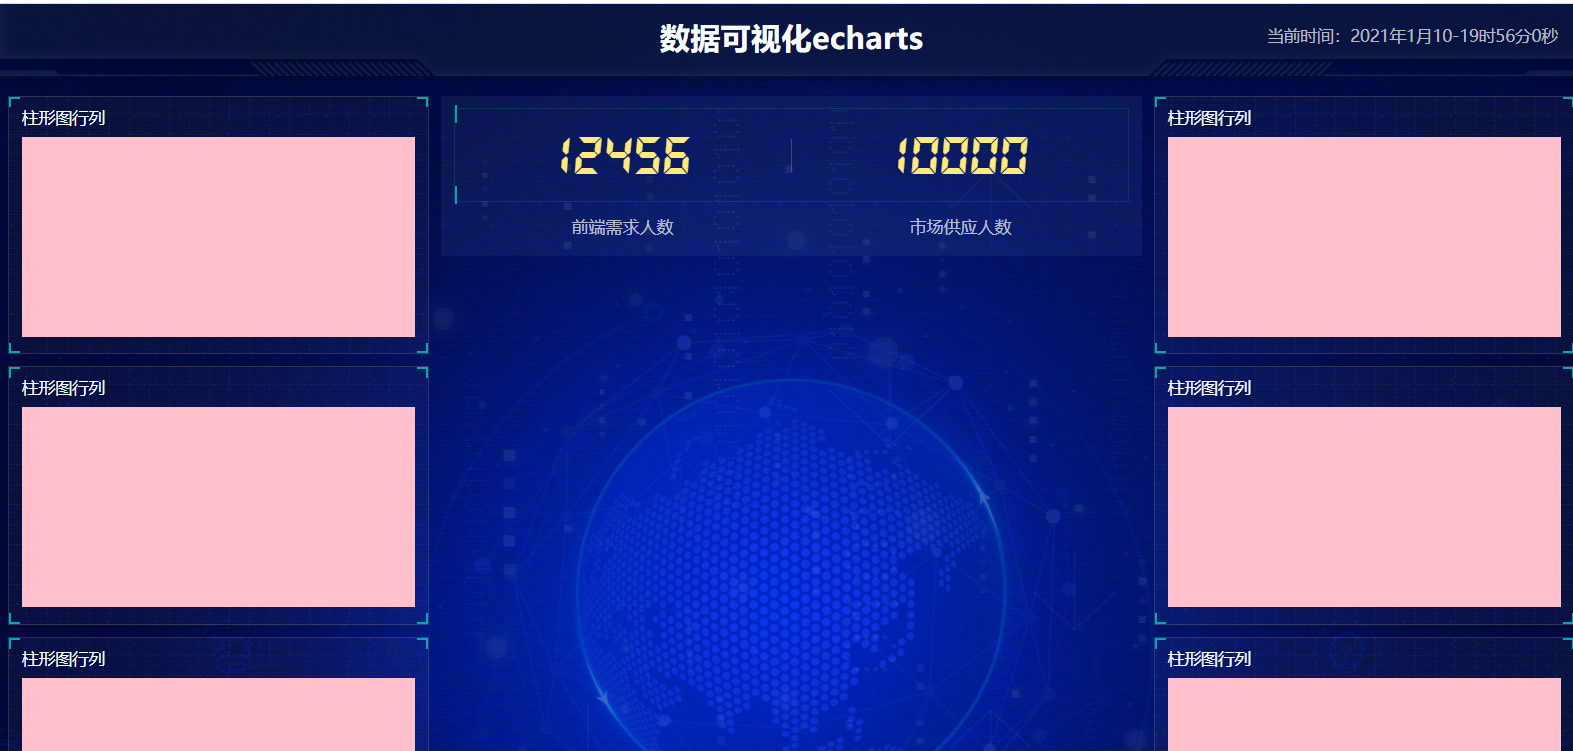
<!DOCTYPE html><html lang="en"><head><meta charset="UTF-8"><meta name="viewport" content="width=device-width, initial-scale=1.0"><title>Document</title><link rel="stylesheet" href="css/index.css"><!-- 引入屏幕适配js --><script src="js/flexible.js"></script><script src="js/echarts.min.js"></script><script src="js/jquery.js"></script><script src="js/china.js"></script><script> var t = null; t = setTimeout(time, 1000); //開始运行 function time() { clearTimeout(t); //清除定时器 dt = new Date(); var y = dt.getFullYear(); var mt = dt.getMonth() + 1; var day = dt.getDate(); var h = dt.getHours(); //获取时 var m = dt.getMinutes(); //获取分 var s = dt.getSeconds(); //获取秒 document.querySelector(".showTime").innerHTML = "当前时间:" + y + "年" + mt + "月" + day + "-" + h + "时" + m + "分" + s + "秒"; t = setTimeout(time, 1000); //设定定时器,循环运行 } </script></head><body><!-- 开始书写头文件 --><header><h1>数据可视化echarts</h1><div class="showTime"></div></header><!-- 页面主体部分 --><section class="minbox"><div class="coloum"><div class="panel bar"><h2>柱形图行列</h2><div class="chart"></div><div class="panel-footer"></div></div><div class="panel line"><h2>折线图行列</h2><div class="chart"></div><div class="panel-footer"></div></div><div class="panel pie"><h2>饼行列</h2><div class="chart"></div><div class="panel-footer"></div></div></div><div class="coloum"><div class="no"><div class="no-hd"><ul><li>12456</li><li>10000</li></ul></div><div class="no-bd"><ul><li>前端需求人数</li><li>市场供应人数</li></ul></div></div><!-- 地图模块 --><div class="map"><div class="map1"></div><div class="map2"></div><div class="map3"></div><div class="chart"></div></div></div><div class="coloum"><div class="panel bar2"><h2>柱形图行列</h2><div class="chart"></div><div class="panel-footer"></div></div><div class="panel line2"><h2>柱形图行列</h2><div class="chart"></div><div class="panel-footer"></div></div><div class="panel pie2"><h2>柱形图行列</h2><div class="chart"></div><div class="panel-footer"></div></div></div></section><script src="js/myindex.js"></script></body></html>
前端所需要的js
* {padding: 0;margin: 0;box-sizing: border-box;}li {list-style: none;}@font-face {font-family: electron;src: url(../font/DS-DIGIT.TTF);}body {background: url(../images/bg.jpg) no-repeat top center;line-height: 1.15;}header {height: 1.25rem;position: relative;background: url(../images/head_bg.png) no-repeat;background-size: 100% 100%;}header h1 {font-size: 0.457rem;color: white;text-align: center;line-height: 1rem;}header .showTime {position: absolute;right: 0.375rem;top: 0;line-height: 0.9375rem;font-size: 0.25rem;color: rgba(255, 255, 255, 0.7);}.minbox {display: flex;max-width: 1920px;min-width: 1080px;height: 7.5rem;padding: 0.125rem 0.125rem 0;margin: 0 auto;}.minbox .coloum {flex: 3;}.minbox .coloum:nth-child(2) {flex: 5;margin: 0 0.1875rem 0.125rem;}.minbox .panel {position: relative;height: 3.875rem;padding: 0 0.1875rem 0.5rem;margin-bottom: 0.1875rem;border: 1px solid rgba(255, 186, 139, 0.17);background: url(../images/line.png) rgba(255, 255, 255, 0.03);}.minbox .panel .chart {height: 3rem;background-color: pink;}.minbox .panel h2 {height: 0.6rem;line-height: 0.6rem;font-size: 0.25rem;color: #ffffff;font-weight: 400;}.minbox .panel::before {position: absolute;height: 0.125rem;width: 0.125rem;top: 0;left: 0;border-left: 2px solid #02a6b5;border-top: 2px solid #02a6b5;content: "";}.minbox .panel::after {position: absolute;height: 0.125rem;width: 0.125rem;top: 0;right: 0;border-right: 2px solid #02a6b5;border-top: 2px solid #02a6b5;content: "";}.minbox .panel .panel-footer {position: absolute;width: 100%;bottom: 0;left: 0;}.minbox .panel .panel-footer::before {position: absolute;height: 0.125rem;width: 0.125rem;bottom: 0;left: 0;border-left: 2px solid #02a6b5;border-bottom: 2px solid #02a6b5;content: "";}.minbox .panel .panel-footer::after {position: absolute;height: 0.125rem;width: 0.125rem;bottom: 0;right: 0;border-right: 2px solid #02a6b5;border-bottom: 2px solid #02a6b5;content: "";}.no {background-color: rgba(101, 132, 226, 0.1);padding: 0.1875rem;}.no .no-bd ul {display: flex;}.no .no-bd ul li {flex: 1;text-align: center;color: rgba(255, 255, 255, 0.7);font-size: 0.255rem;height: 0.5rem;line-height: 0.5rem;margin-top: 0.125rem;}.no .no-hd {border: 1px solid rgba(25, 186, 139, 0.17);position: relative;}.no .no-hd ul {display: flex;}.no .no-hd ul li {position: relative;flex: 1;line-height: 1rem;font-size: 0.875rem;color: #ffeb7b;text-align: center;font-family: electron;}.no .no-hd ul li:nth-child(1):after {content: "";position: absolute;top: 25%;right: 0;height: 50%;width: 1px;background-color: rgba(255, 255, 255, 0.2);}.no .no-hd::after {position: absolue;height: 10px;width: 30px;right: 0;bottom: 0;border-right: 2px solid #02a6b5;border-bottom: 2px solid #02a6b5;content: " ";}.no .no-hd::before {position: absolue;height: 10px;width: 30px;top: 0;left: 0;content: " ";border-top: 2px solid #02a6b5;border-left: 2px solid #02a6b5;}.map {height: 10.125rem;position: relative;}.map .map1 {width: 6.475rem;height: 6.475rem;position: absolute;top: 50%;left: 50%;transform: translate(-50%, -50%);background: url(../images/map.png);opacity: 0.3;background-size: 100% 100%;}.map .map2 {position: absolute;top: 50%;left: 50%;transform: translate(-50%, -50%);width: 8.375rem;height: 8.375rem;background: url(../images/lbx.png);background-size: 100% 100%;animation: rotaltal1 15s linear infinite;opacity: 0.3;}@keyframes rotaltal1 {from {transform: translate(-50%, -50%) rotate(0deg);}to {transform: translate(-50%, -50%) rotate(360deg);}}.map .map3 {position: absolute;top: 50%;left: 50%;transform: translate(-50%, -50%);width: 7.075rem;height: 7.075rem;background: url(../images/jt.png);background-size: 100% 100%;animation: rotaltal2 10s linear infinite;opacity: 0.3;}@keyframes rotaltal2 {from {transform: translate(-50%, -50%) rotate(0deg);}to {transform: translate(-50%, -50%) rotate(-360deg);}}.map .chart {position: absolute;top: 0;left: 0;width: 100%;height: 10.125rem;}
效果如下
2.3 echarts 使用
常见的数据可视化库
- D3.js 目前web 端评价最高的javascript 可视化工具
- Echart.js 百度出品的一个开源的javascript 数据可视化库–以及收入到apache
- HighCharts.js 是国外的前端数据可视化库,非商用免费,许多国外大公司所用
- AntV 蚂蚁金服全新一代的数据可视化解决方案
实例提供
https://echarts.apache.org/examples/zh/index.html#chart-type-bar
下载并引入echarts.js
页面下载
https://echarts.apache.org/zh/download.html
npm 安装
npm install echarts
引入js
<!DOCTYPE html><html><head><meta charset="utf-8"><!-- 引入 ECharts 文件 --><script src="echarts.min.js"></script></head></html>
准备一个具备大小的盒子
<!-- 为 ECharts 准备一个具备大小(宽高)的 DOM --><div id="main" style="width: 600px;height:400px;"></div>
初始化echarts 实例对象
var myChart = echarts.init(document.querySelector(".bar"));
制定配置项和数据
// 指定图表的配置项和数据var option = {title: {text: 'ECharts 入门示例'},tooltip: { },legend: {data:['销量']},xAxis: {data: ["衬衫","羊毛衫","雪纺衫","裤子","高跟鞋","袜子"]},yAxis: { },series: [{name: '销量',type: 'bar',data: [5, 20, 36, 10, 10, 20]}]};
将配置项设置给echarts 实例对象
// 使用刚指定的配置项和数据显示图表。myChart.setOption(option);
完整的demo
<!DOCTYPE html><html><head><meta charset="utf-8"><title>ECharts</title><!-- 引入 echarts.js --><script src="echarts.min.js"></script></head><body><!-- 为ECharts准备一个具备大小(宽高)的Dom --><div id="main" style="width: 600px;height:400px;"></div><script type="text/javascript"> // 基于准备好的dom,初始化echarts实例 var myChart = echarts.init(document.getElementById('main')); // 指定图表的配置项和数据 var option = { title: { text: 'ECharts 入门示例' }, tooltip: { }, legend: { data:['销量'] }, xAxis: { data: ["衬衫","羊毛衫","雪纺衫","裤子","高跟鞋","袜子"] }, yAxis: { }, series: [{ name: '销量', type: 'bar', data: [5, 20, 36, 10, 10, 20] }] }; // 使用刚指定的配置项和数据显示图表。 myChart.setOption(option); </script></body></html>


还没有评论,来说两句吧...