python机器学习入门之matplotlib的使用(超详细,必看)
matplotlib是python的一个基本2D绘图库 功能强大
比较常用的是里面的pyplot子模块
常见函数有figure()创建一个空白画布 add_subplot()创建子图 title()设置标题
xlabel()设置x轴名称 ylabel()设置y轴名称 legend()指定图例 show()显示图形等等
实例一如下
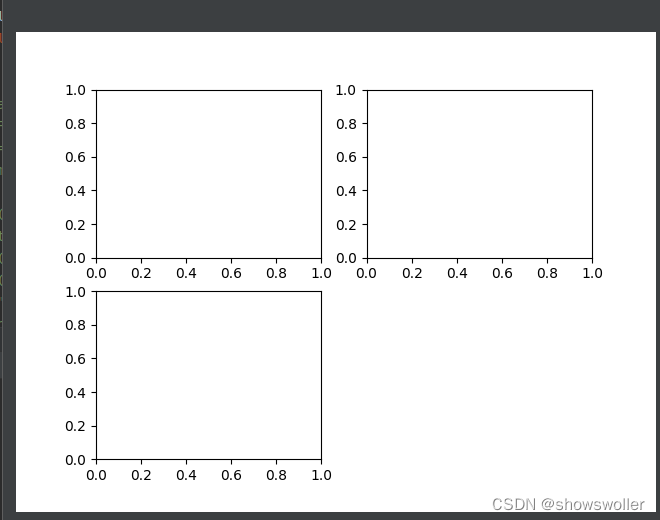
代码如下
import pandas as pdimport numpy as npfrom pandas import Seriesfrom numpy import nan as NAimport matplotlib.pyplot as pltfrom mpl_toolkits.mplot3d import Axes3Dfig=plt.figure()ax1=fig.add_subplot(2,2,1)ax2=fig.add_subplot(2,2,2)ax3=fig.add_subplot(2,2,3)plt.show()
2:在子图上绘制图形 如三角形 椭圆 矩形
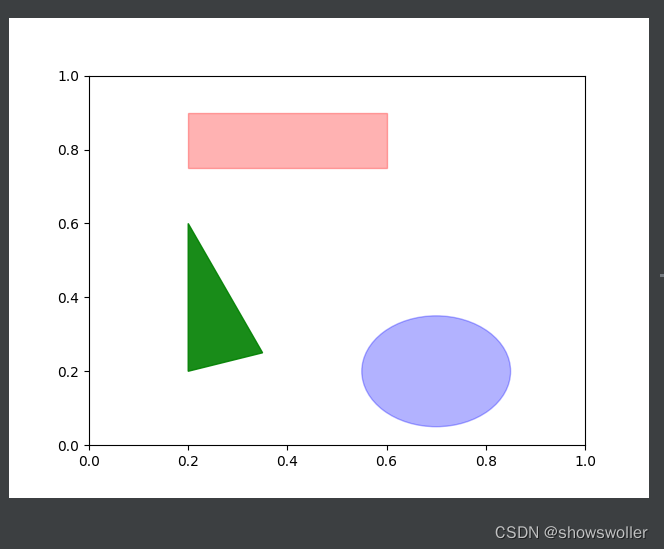
代码如下
import pandas as pdimport numpy as npfrom pandas import Seriesfrom numpy import nan as NAimport matplotlib.pyplot as pltfrom mpl_toolkits.mplot3d import Axes3Dax=fig.add_subplot(1,1,1)rect=plt.Rectangle((0.2,0.75),0.4,0.15,color='r',alpha=0.3)cir=plt.Circle((0.7,0.2),0.15,color='b',alpha=0.3)pgon=plt.Polygon([[0.2,0.2],[0.35,0.25],[0.2,0.6]],color='g',alpha=0.9)ax.add_patch(rect)ax.add_patch(cir)ax.add_patch(pgon)plt.show()
3:直线图的绘画
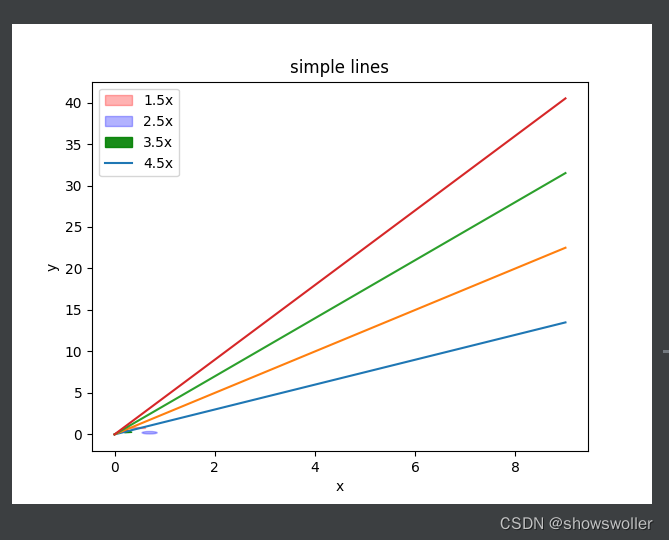
import pandas as pdimport numpy as npfrom pandas import Seriesfrom numpy import nan as NAimport matplotlib.pyplot as pltfrom mpl_toolkits.mplot3d import Axes3Da=np.arange(10)plt.xlabel('x')plt.ylabel('y')plt.plot(a,a*1.5,a,a*2.5,a,a*3.5,a,a*4.5)plt.legend(['1.5x','2.5x','3.5x','4.5x'])plt.title('simple lines')j=np.linspace(-10,10,100)k=np.sin(j)plt.plot(j,k,marker="o")plt.show()
4:为series数据绘制图形
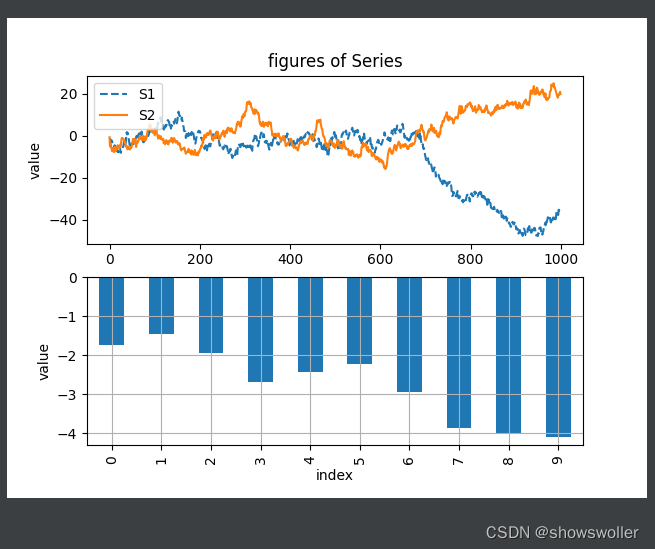
import numpy as npfrom pandas import Seriesfrom numpy import nan as NAimport matplotlib.pyplot as pltfrom mpl_toolkits.mplot3d import Axes3Ds1=Series(np.random.randn(1000).cumsum())s2=Series(np.random.randn(1000).cumsum())plt.subplot(2,1,1)ax1=s1.plot(kind='line',label='S1',title="figures of Series",style='--')s2.plot(ax=ax1,kind='line',label='S2')plt.ylabel('value')plt.legend(loc=2)plt.subplot(2,1,2)s1[0:10].plot(kind='bar',grid=True,label='s1')plt.xlabel('index')plt.ylabel('value')plt.show()
5:三维图形的绘画 虽说matplotlib主要用于二维图形绘制 但是三维的也可以画
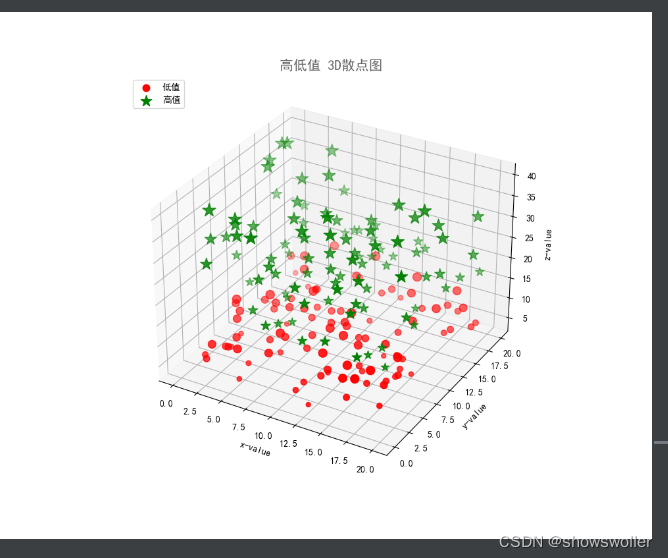
import numpy as npfrom pandas import Seriesfrom numpy import nan as NAimport matplotlib.pyplot as pltfrom mpl_toolkits.mplot3d import Axes3Ddef randrange(n,randFloor,randceil):rnd=np.random.rand(n)return (randceil-randFloor)*rnd+randFloorplt.rcParams['font.sans-serif']=['SimHei']fig=plt.figure(figsize=(10,8))ax=fig.add_subplot(111,projection="3d")n=100for zmin,zmax,c,m,l in[(4,15,'r','o','低值'),(13,40,'g','*','高值')]:x=randrange(n,0,20)y=randrange(n,0,20)z=randrange(n,zmin,zmax)ax.scatter(x,y,z,c=c,marker=m,label=l,s=z*6)ax.set_xlabel("x-value")ax.set_ylabel("y-value")ax.set_zlabel("z-value")ax.set_title("高低值 3D散点图",alpha=0.6,size=15,weight='bold')ax.legend(loc="upper left")plt.show()
觉得有帮助请点赞收藏喔


还没有评论,来说两句吧...