echarts 柱状图案例(屏幕自适应、元素自适应、动态显示、配置逻辑)
自适应:(1)window.onresize监听调用echarts.init对象.resize()方法实现图表自适应(2)获取图表容器的宽度/100,分成100份,然后根据份数来调整元素合适的大小(3)在第一次加载、刷新和窗口改变时,都需要实现(2)的步骤配置逻辑:(1)第一次option进行自适应元素高宽的配置,即在监听中进行(2)第二次option进行样式的配置(3)第三次option进行数据的配置组件卸载时需要卸载监听
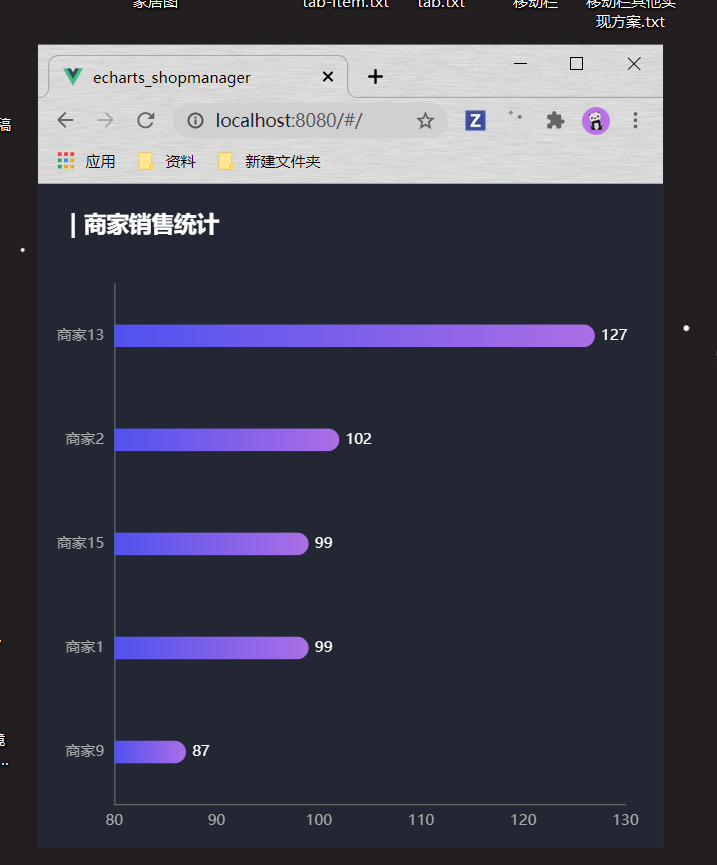
效果图:
代码示例:
<template><!-- 横向柱状图 --><div class='s-c'><div class='s-chart' ref='sell'></div></div></template><script>import chalk from '../../static/theme/chalk'export default {name:'sell',data(){return{myMap:null,data:[],currentPage:1,totalPage:0,timer:null,first:true}},mounted(){this._initChart();this._getData();//适配化配置调用this._resize();this._mouse();},//组件销毁前卸载监听beforeDestroy(){window.onresize=null;},methods:{async _getData(){let res=await this.$axios.get('/api/seller');this.data=res.data;//数据进行排序this.data.sort((a,b)=>{return a.value-b.value})//每五个显示一页,计算总页数this.totalPage=this.data.length%5==0? this.data.length/5:Math.ceil(this.data.length/5);this._updateChart();},_initChart(){this.myMap = this.$echarts.init(this.$refs.sell,'chalk');//完成除数据和宽度适配以外的一些初始配置let option={title:{text:'| 商家销售统计',left: 20,top: 20,},grid: {top: '15%',left: '3%',right: '6%',bottom: '3%',containLabel: true // 距离是包含坐标轴上的文字},xAxis:{type:'value',splitLine:{ //去掉坐标轴的水平虚线指示线show:false},scale:true,},yAxis:{type:'category',},tooltip:{trigger:'axis',axisPointer:{type:'line',z:0,lineStyle:{color:'#2d3443',}},},series:[{type:'bar',barWidth:66,itemStyle:{color:{type: 'linear',x: 0,y: 0,x2: 1,y2: 0,colorStops: [{offset: 0, color: '#5052EE' // 0% 处的颜色}, {offset: 1, color: '#AB6EE5' // 100% 处的颜色}],global: false,},},label:{show:true,position: 'right',color:'white'}}],}this.myMap.setOption(option);},//根据数据配置图表_updateChart(){//根据当前页数获取对应数据let start=(this.currentPage-1)*5;let end=start+5;const showData=this.data.slice(start,end);const seriesName=showData.map((item,index)=>{return item.name;})const seriesValue=showData.map((item,index)=>{return item.value})//数据改变时配置let option={yAxis:{data:seriesName,},series:[{data:seriesValue,}],}this.myMap.setOption(option);this._setInterval();},//定时器刷新当前数据_setInterval(){// console.log(this.currentPage);if(this.timer){clearInterval(this.timer);}let that=this;this.timer=setInterval(() => {if(this.currentPage>=this.totalPage){this.currentPage=1;}else{this.currentPage++;}this._updateChart();}, 3000);},//适配监听,整体图表,已经图表中的元素适配_resize(){//第一次打开和刷新不改变窗口时,也进行适配if(this.first){this._resizeCode();this.first=false;}//标题大小适配,根据容器大小分成100份,根据份数来试window.onresize=()=>{this._resizeCode();}},//适配代码_resizeCode(){let container=this.$refs.sell.offsetWidth;let titleFontSize=container/100*3.6;//适配图表let option={title:{textStyle:{fontSize:titleFontSize}},tooltip:{axisPointer:{lineStyle:{width:titleFontSize}}},series:{barWidth:titleFontSize,itemStyle: {barBorderRadius: [0, titleFontSize / 2, titleFontSize / 2, 0]}}}this.myMap.setOption(option);this.myMap.resize();},//鼠标监听,鼠标放上停止,移开播放_mouse(){this.myMap.on('mouseover',()=>{clearInterval(this.timer);})this.myMap.on('mouseout',()=>{this._updateChart();})}}}</script><style lang='less' scoped>.s-c{width: 100%;height:100%;.s-chart{width: 100%;height:100%;}}</style>


")


还没有评论,来说两句吧...