Vue中封装的echarts组件
先上效果图
最近做的项目中图表用到很多,所以简单记录下,目录结构很简单
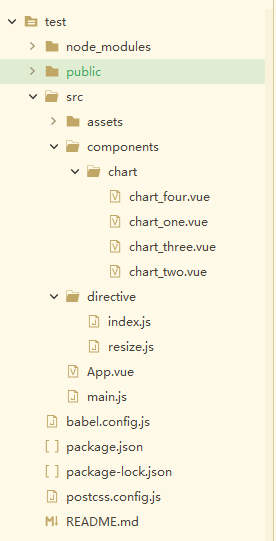
这里的resize.js是大佬写的一个监听窗口缩放的的事件,index.js是全局注册的 v-resize 自定义指令,在每个组件中都使用到了。
resize.js
// 按钮权限判断指令const resize = {inserted: (el, binding, vNode) => {// 指令的绑定值,是一个function函数const callback = binding.value// 延时执行函数的毫秒数const debounce = binding.arg || 200// 禁止执行与事件关联的默认动作const options = binding.modifiers || { passive: true }let debounceTimeout = nullconst onResize = () => {clearTimeout(debounceTimeout)debounceTimeout = setTimeout(callback, debounce, options)}// 监听窗口缩放window.addEventListener('customResize', onResize, options)window.addEventListener('resize', onResize, options)// 存储监听窗口缩放事件的参数,方便在unbind钩子函数中解除事件绑定的时候使用到el._onResize = {onResize,options}},unbind (el, binding) {const { onResize, options } = el._onResize;window.removeEventListener('customResize', onResize, options)window.removeEventListener('resize', onResize, options)delete el._onResize}};export default resize;
index.js
import resize from './resize';const importDirective = Vue => {/*** 容器大小变化回调 v-resize='function'* code 按钮编号*/Vue.directive('resize', resize);};export default importDirective;
main.js很简单,主要是将importDirective 运用在了全局
import Vue from 'vue'import App from './App.vue'import importDirective from "./directive";Vue.use(importDirective)Vue.config.productionTip = falsenew Vue({render: h => h(App),}).$mount('#app')
App.vue
<template><div id="app"><div class="chart_content"><div>横向柱状图</div><chartOne :data="data_val" :yAxis="yAxis"></chartOne></div><div class="chart_content"><div>饼状图</div><chartTwo :data="chart_two_data"></chartTwo></div><div class="chart_content"><div>环形图</div><chartThree :data="chart_two_data"></chartThree></div><div class="chart_content"><div>折线图</div><chartFour :legendone="four_legend_data_one" :legendtwo="four_legend_data_two" :xAxis="four_xAxis_data" :series="four_series_data"></chartFour></div></div></template><script>import chartOne from './components/chart/chart_one.vue'import chartTwo from './components/chart/chart_two.vue'import chartThree from './components/chart/chart_three.vue'import chartFour from './components/chart/chart_four.vue'export default {name: 'app',components: {chartOne,chartTwo,chartThree,chartFour},data() {return {data_val:[1,2,3,40],yAxis:['111','222','333','444'],chart_two_data: [{value: 1048,name: '火影'},{value: 735,name: '海贼'},{value: 580,name: '死神'},{value: 484,name: '龙珠'},{value: 300,name: '幽游白书'},{value: 300,name: '猫和老鼠'}],four_legend_data_one: ['火影', '海贼', '死神', '龙珠', '葫芦娃'],four_legend_data_two: ['火影-新版', '海贼-新版', '死神-新版', '龙珠-新版', '葫芦娃-新版'],four_xAxis_data: ['2020/0/01', '2020/0/02', '2020/0/03', '2020/0/04', '2020/0/05', '2020/0/06','2020/0/07'],four_series_data: [{name: '火影',type: 'line',stack: '工单总量',data: [120, 132, 101, 134, 90, 230, 210]},{name: '海贼',type: 'line',stack: '工单总量',data: [120, 132, 101, 134, 90, 230, 210]},{name: '死神',type: 'line',stack: '工单总量',data: [120, 132, 101, 134, 90, 230, 210]},{name: '龙珠',type: 'line',stack: '工单总量',data: [120, 132, 101, 134, 90, 230, 210]},{name: '葫芦娃',type: 'line',stack: '工单总量',data: [120, 132, 101, 134, 90, 230, 210]},{name: '火影-新版',type: 'line',stack: '工单总量',data: [120, 132, 101, 134, 90, 230, 210]},{name: '海贼-新版',type: 'line',stack: '工单总量',data: [120, 132, 101, 134, 90, 230, 210]},{name: '死神-新版',type: 'line',stack: '工单总量',data: [120, 132, 101, 134, 90, 230, 210]},{name: '龙珠-新版',type: 'line',stack: '工单总量',data: [120, 132, 101, 134, 90, 230, 210]},{name: '葫芦娃-新版',type: 'line',stack: '工单总量',data: [120, 132, 101, 134, 90, 230, 210]}],}},computed: {},}</script><style>#app {display: flex;flex-wrap: wrap;}.chart_content {border: 1px solid #ededed;width: calc((100% - 20px)/2);height: 400px;margin-bottom: 10px;}.chart_content:nth-child(odd) {margin-right: 10px;}</style>
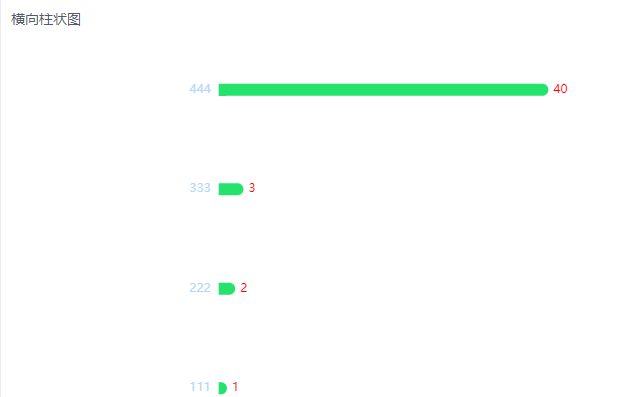
横向柱状图 chartOne 组件
<template><div class="chart" v-resize="resizeCharts" ref="barChart"></div></template><script>import * as echarts from "echarts";export default {name: "barChart",props: {data: {type: Array,default() {return [];},},yAxis: {type: Array,default() {return [];},},},data() {return {charts: null,};},computed: {},methods: {resizeCharts() {this.charts.resize();},initCharts() {this.$nextTick(() => {this.charts = echarts.init(this.$refs.barChart);this.charts.clear();this.setOption();});},setOption() {const option = this.getOption();this.charts.setOption(option, true);},getOption() {const option = {grid: {top: 0,bottom: 0,left: "35%",right: "12%",},color: "#23E36D",yAxis: {type: "category",axisTick: {show: false,},splitLine: {show: false,},axisLabel: {interval: 0,color: "#b4d7fa",},axisLine: {show: false,},data: this.yAxis,},xAxis: {type: "value",axisTick: {show: false,},splitLine: {show: false,},axisLabel: {show: false,},axisLine: {show: false,},},series: [{data: this.data,type: "bar",itemStyle: {barBorderRadius: [0, 6, 6, 0],},emphasis: {itemStyle: {opacity: 0.85}},barWidth: 12,label: {show: true,position: "right",color: "red",},},],};return option;},},mounted() {this.initCharts();},beforeDestroy() {this.charts && this.charts.dispose();this.charts = null;},watch: {data: {handler() {this.setOption();},},yAxis: {handler() {this.setOption();},},},components: {},};</script><style scoped>.chart {width: 100%;height: 100%;}</style>
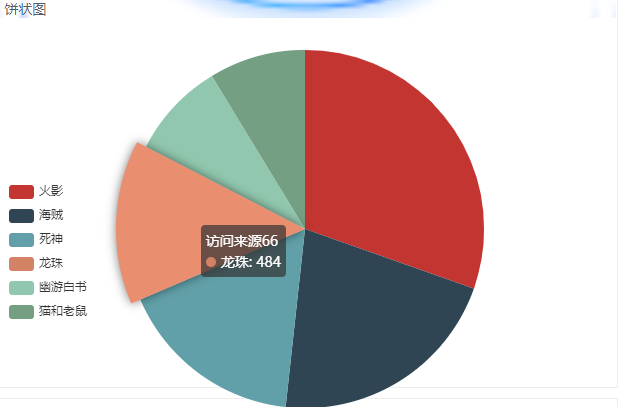
饼状图 chartTwo 组件
<template><div class="chart" v-resize="resizeCharts" ref="barChart"></div></template><script>import * as echarts from "echarts";export default {name: "barChart",props: {data: {type: Array,default () {return [];},}},data() {return {charts: null,};},computed: {},methods: {resizeCharts() {this.charts.resize();},initCharts() {this.$nextTick(() => {this.charts = echarts.init(this.$refs.barChart);this.charts.clear();this.setOption();});},setOption() {const option = this.getOption();this.charts.setOption(option, true);},getOption() {const option = {tooltip: {trigger: 'item'},legend: {orient: 'vertical',left: '10',top: '150',},series: [{name: '访问来源66',type: 'pie',radius: '90%',//圆环的大小center: ['50%', '50%'],//圆环的位置data: this.data,emphasis: {itemStyle: {shadowBlur: 10,shadowOffsetX: 0,shadowColor: 'rgba(0, 0, 0, 0.5)'}},label: { //去除饼图的指示折线labelnormal: {show: false}},}]};return option;},},mounted() {this.initCharts();},beforeDestroy() {this.charts && this.charts.dispose();this.charts = null;},watch: {data: {handler() {this.setOption();},},},components: {},};</script><style scoped>.chart {width: 100%;height: 100%;}</style>
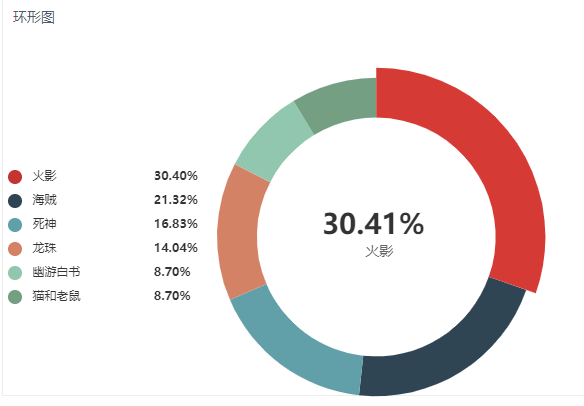
环形图 chartThree 组件
<template><div class="chart" v-resize="resizeCharts" ref="barChart"></div></template><script>import * as echarts from "echarts";export default {name: "barChart",props: {data: {type: Array,default () {return [];},},yAxis: {type: Array,default () {return [];},},},data() {return {charts: null,};},computed: {},methods: {resizeCharts() {this.charts.resize();},initCharts() {this.$nextTick(() => {this.charts = echarts.init(this.$refs.barChart);this.charts.clear();this.setOption();});},setOption() {const option = this.getOption();this.charts.setOption(option, true);},getOption() {const option = {tooltip: {trigger: 'item'},legend: {orient: 'vertical',left: '10',top: '150',},series: [{name: '访问来源',type: 'pie',radius: ['70%', '100%'],//圆环的大小center: ['50%', '50%'],//圆环的位置avoidLabelOverlap: false,label: {show: false,position: 'center'},emphasis: {label: {show: true,fontSize: '20',fontWeight: 'bold'}},labelLine: {show: false},data: this.data}]};return option;},},mounted() {this.initCharts();},beforeDestroy() {this.charts && this.charts.dispose();this.charts = null;},watch: {data: {handler() {this.setOption();},},yAxis: {handler() {this.setOption();},},},components: {},};</script><style scoped>.chart {width: 100%;height: 100%;}</style>
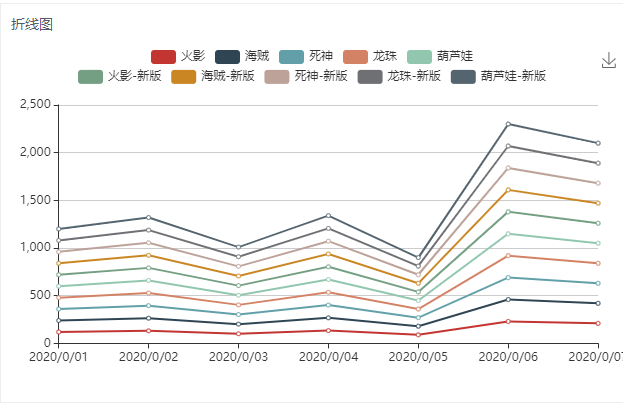
折线图 chartFour 组件
<template><div class="chart" v-resize="resizeCharts" ref="barChart"></div></template><script>import * as echarts from "echarts";export default {name: "barChart",props: {legendone: {type: Array,default () {return [];},},legendtwo: {type: Array,default () {return [];},},xAxis: {type: Array,default () {return [];},},series: {type: Array,default () {return [];},},},data() {return {charts: null,};},mounted() {console.log("999999999")console.log("数据", this.legend)},computed: {},methods: {resizeCharts() {this.charts.resize();},initCharts() {this.$nextTick(() => {this.charts = echarts.init(this.$refs.barChart);this.charts.clear();this.setOption();});},setOption() {const option = this.getOption();this.charts.setOption(option, true);},getOption() {const option = {tooltip: {trigger: 'axis'},// legend: {// data: this.legendone,// align: 'left',// orient: 'horizontal',// left: 'center',// bottom: '40',// },legend: [{data: this.legendone,icon: "roundRect",x: 'center',y: '0%'},{data: this.legendtwo,icon: "roundRect",x: 'center',y: '5%'},],grid: {left: '3%',right: '4%',bottom: '20%',containLabel: true},toolbox: {feature: {saveAsImage: {}}},xAxis: {type: 'category',boundaryGap: false,data: this.xAxis},yAxis: {type: 'value'},series: this.series};return option;},},mounted() {this.initCharts();},beforeDestroy() {this.charts && this.charts.dispose();this.charts = null;},watch: {legendone: {handler() {this.setOption();},},legendtwo: {handler() {this.setOption();},},xAxis: {handler() {this.setOption();},},series: {handler() {this.setOption();},},},components: {},};</script><style scoped>.chart {width: 100%;height: 100%;}</style>


--锁")


还没有评论,来说两句吧...